Radiative Transfer Benchmark
FIXME: Merge with Peter's description/examples for the Diffusion Solver
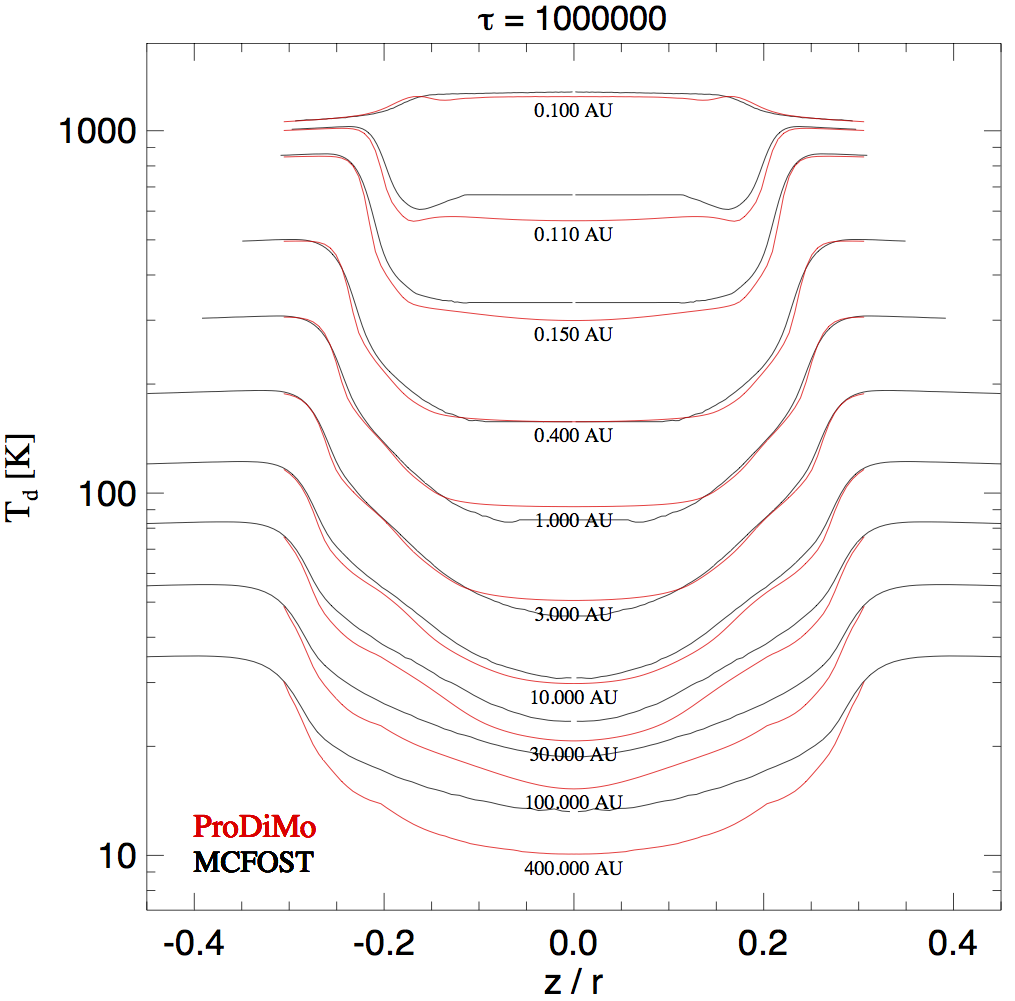
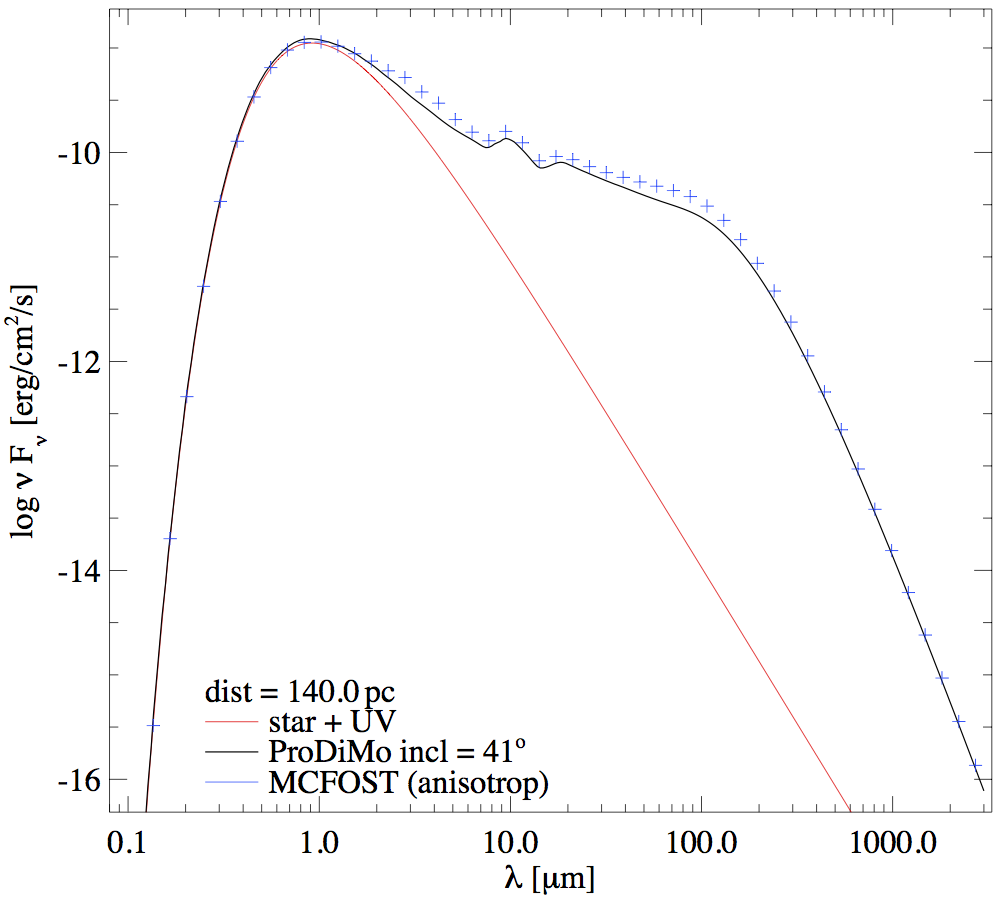
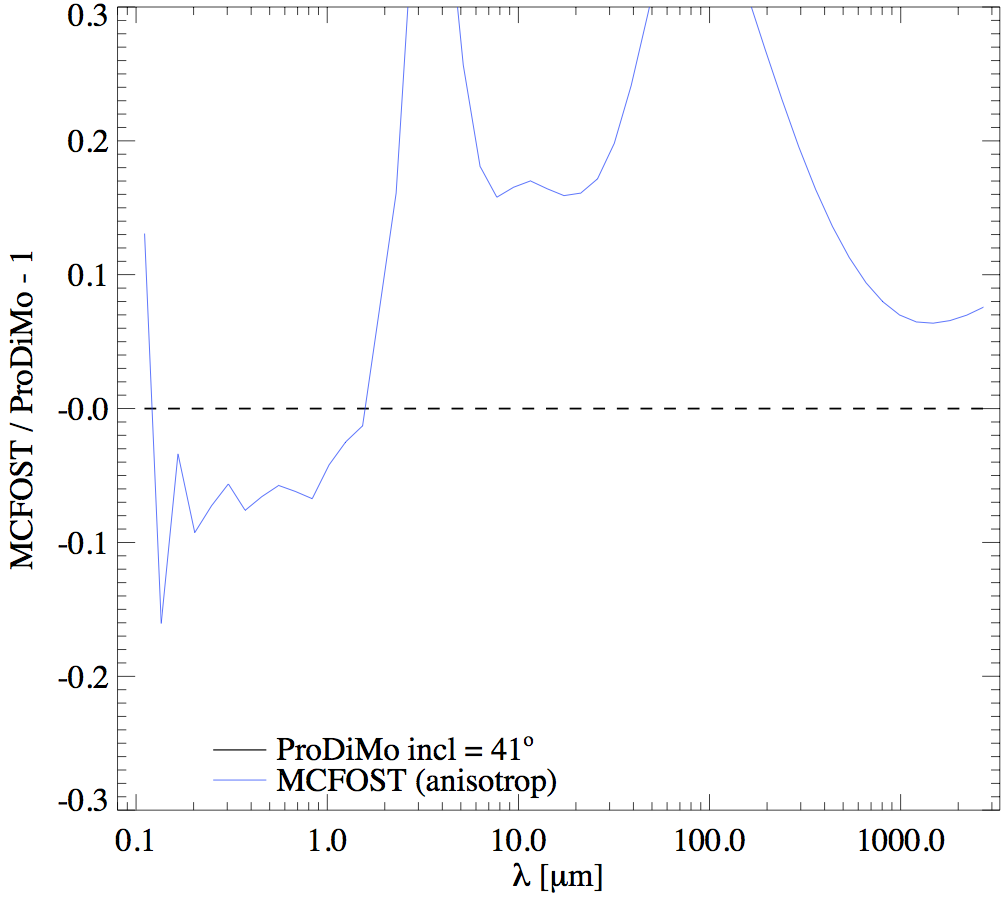
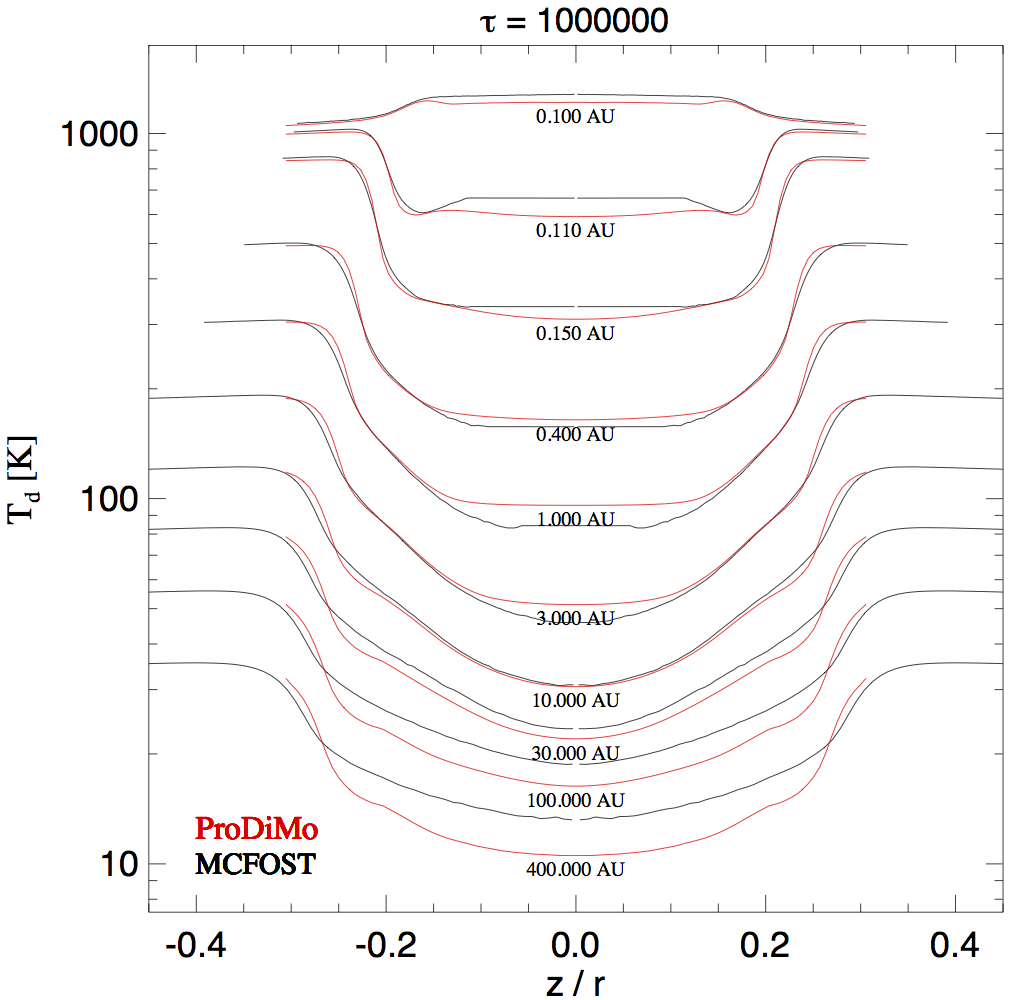
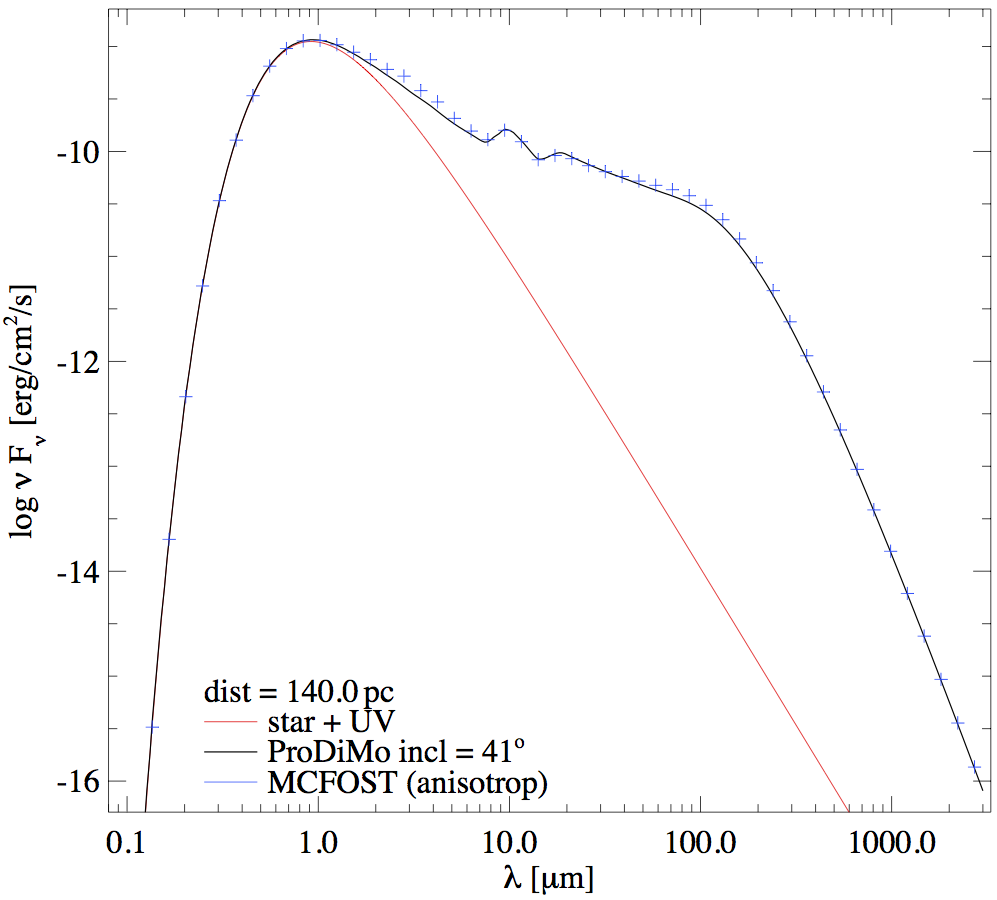
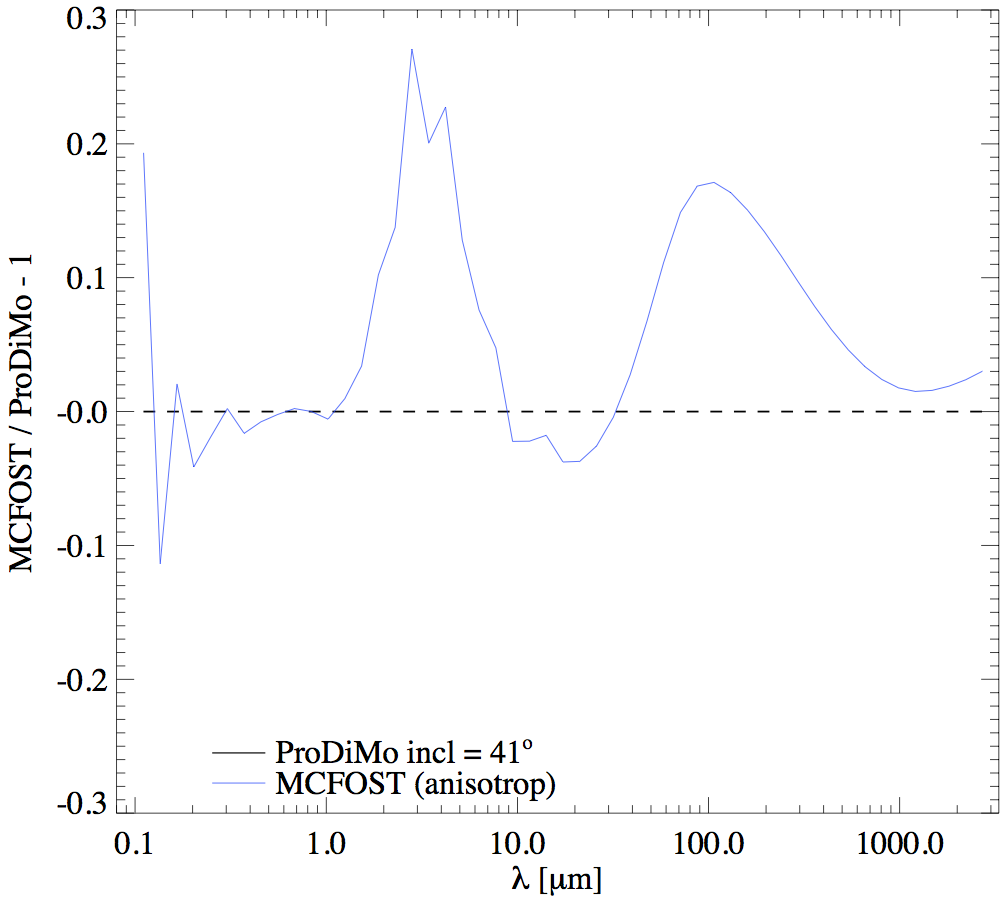
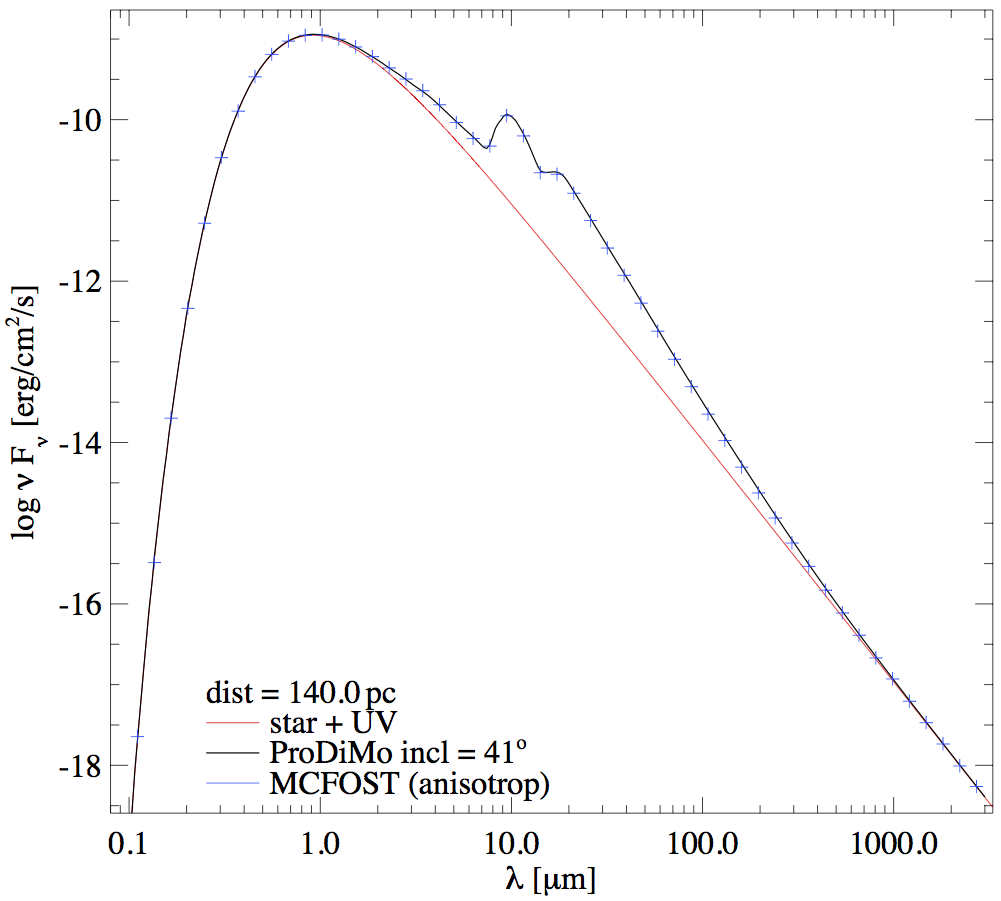
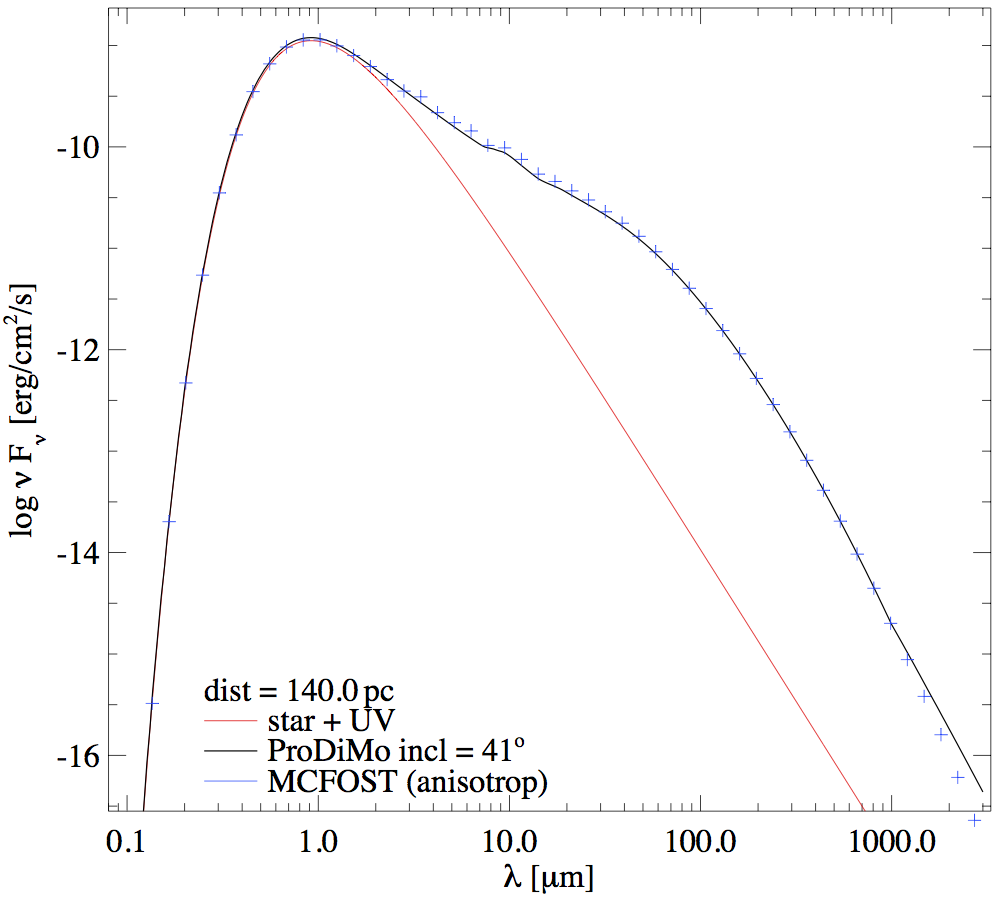
To give an impression of ProDiMo's performance and reliability concerning the dust continuum radiative transfer, I show here some results for the disc benchmark (Pinte et al. 2009), a tricky test case with strongly scattering 1-micron astro-silicate grains in a T Tauri type disk configuration with radial midplane optical depth 1.E+3, 1.E+4, 1.E+5, 1.E+6 at lambda=1mic.
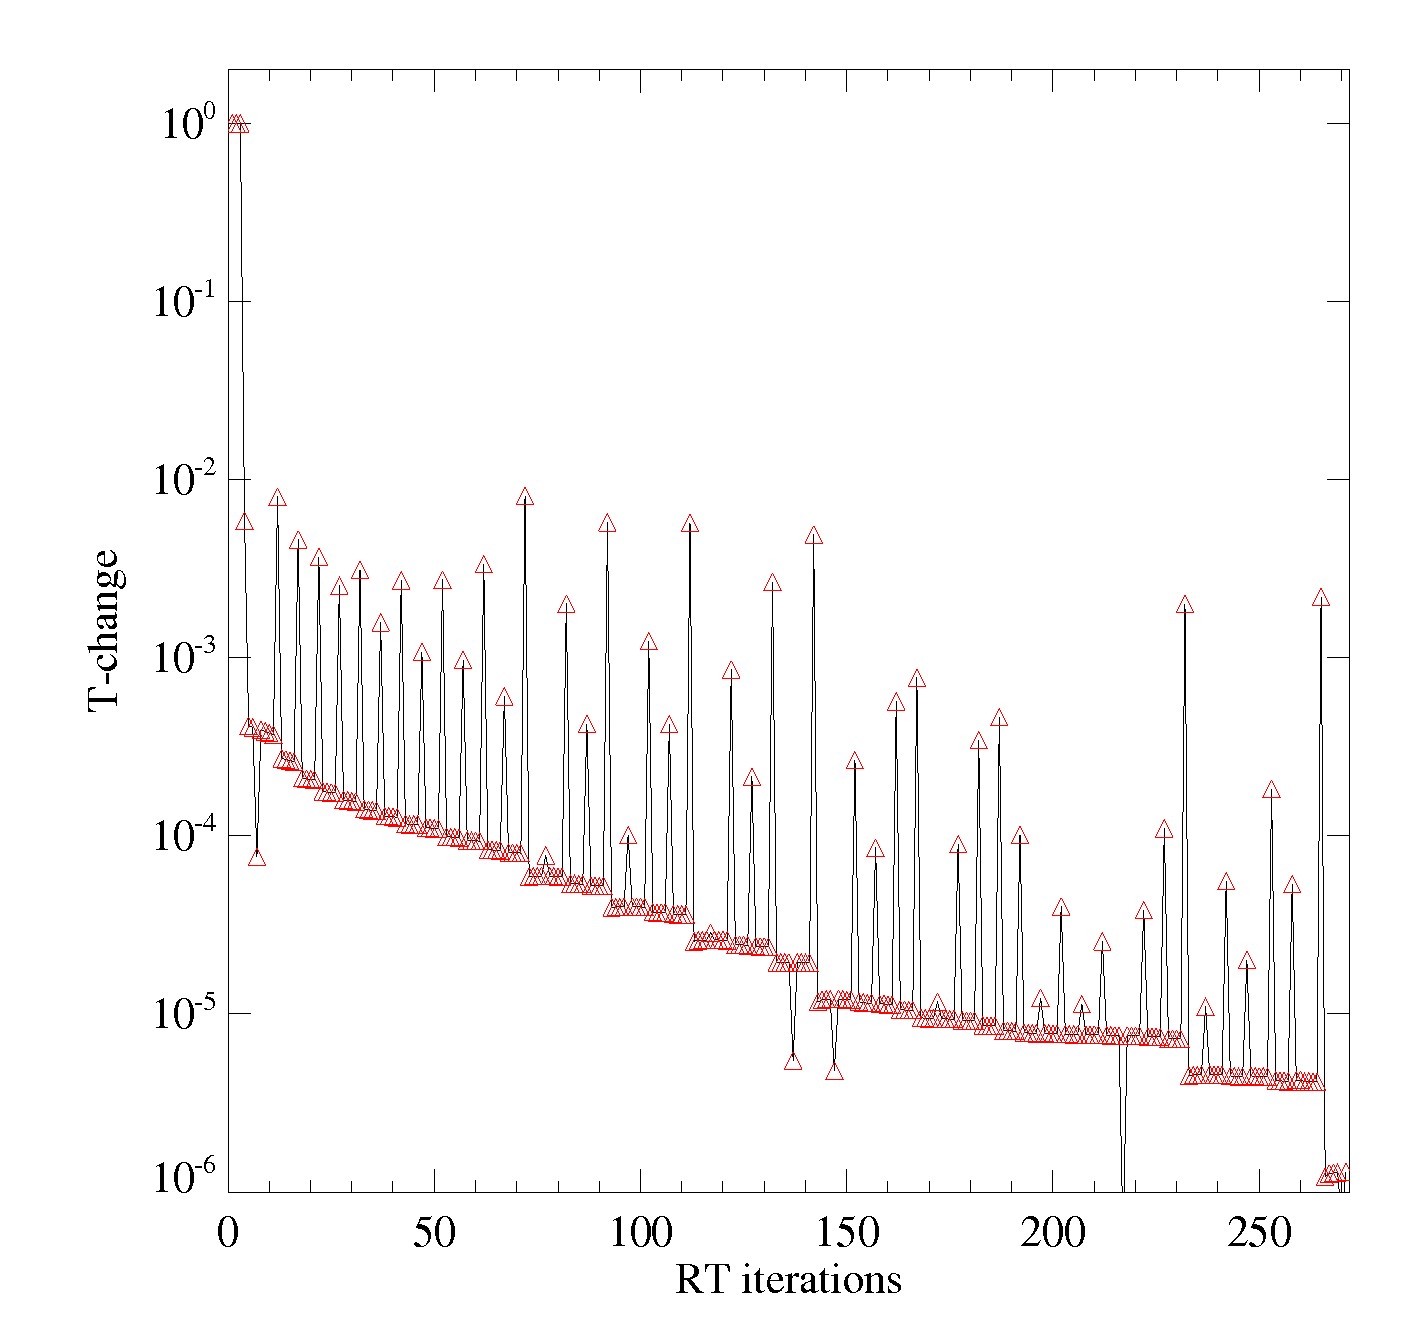
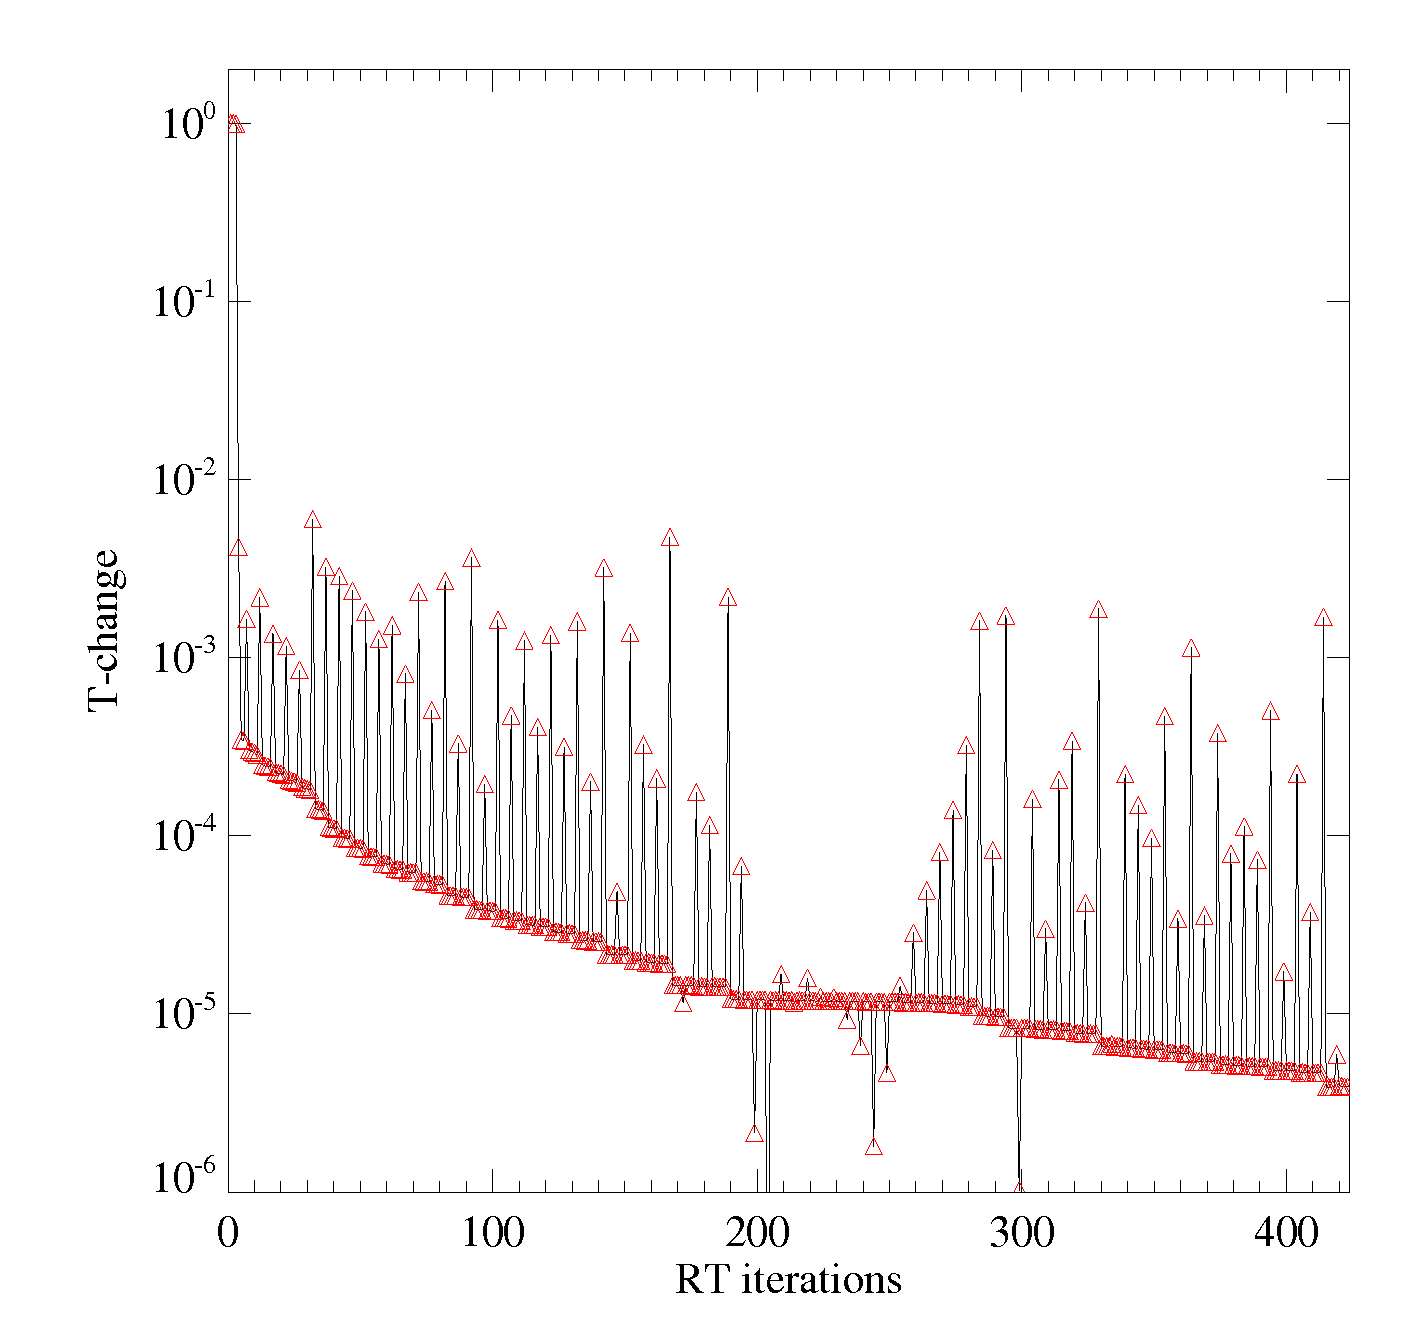
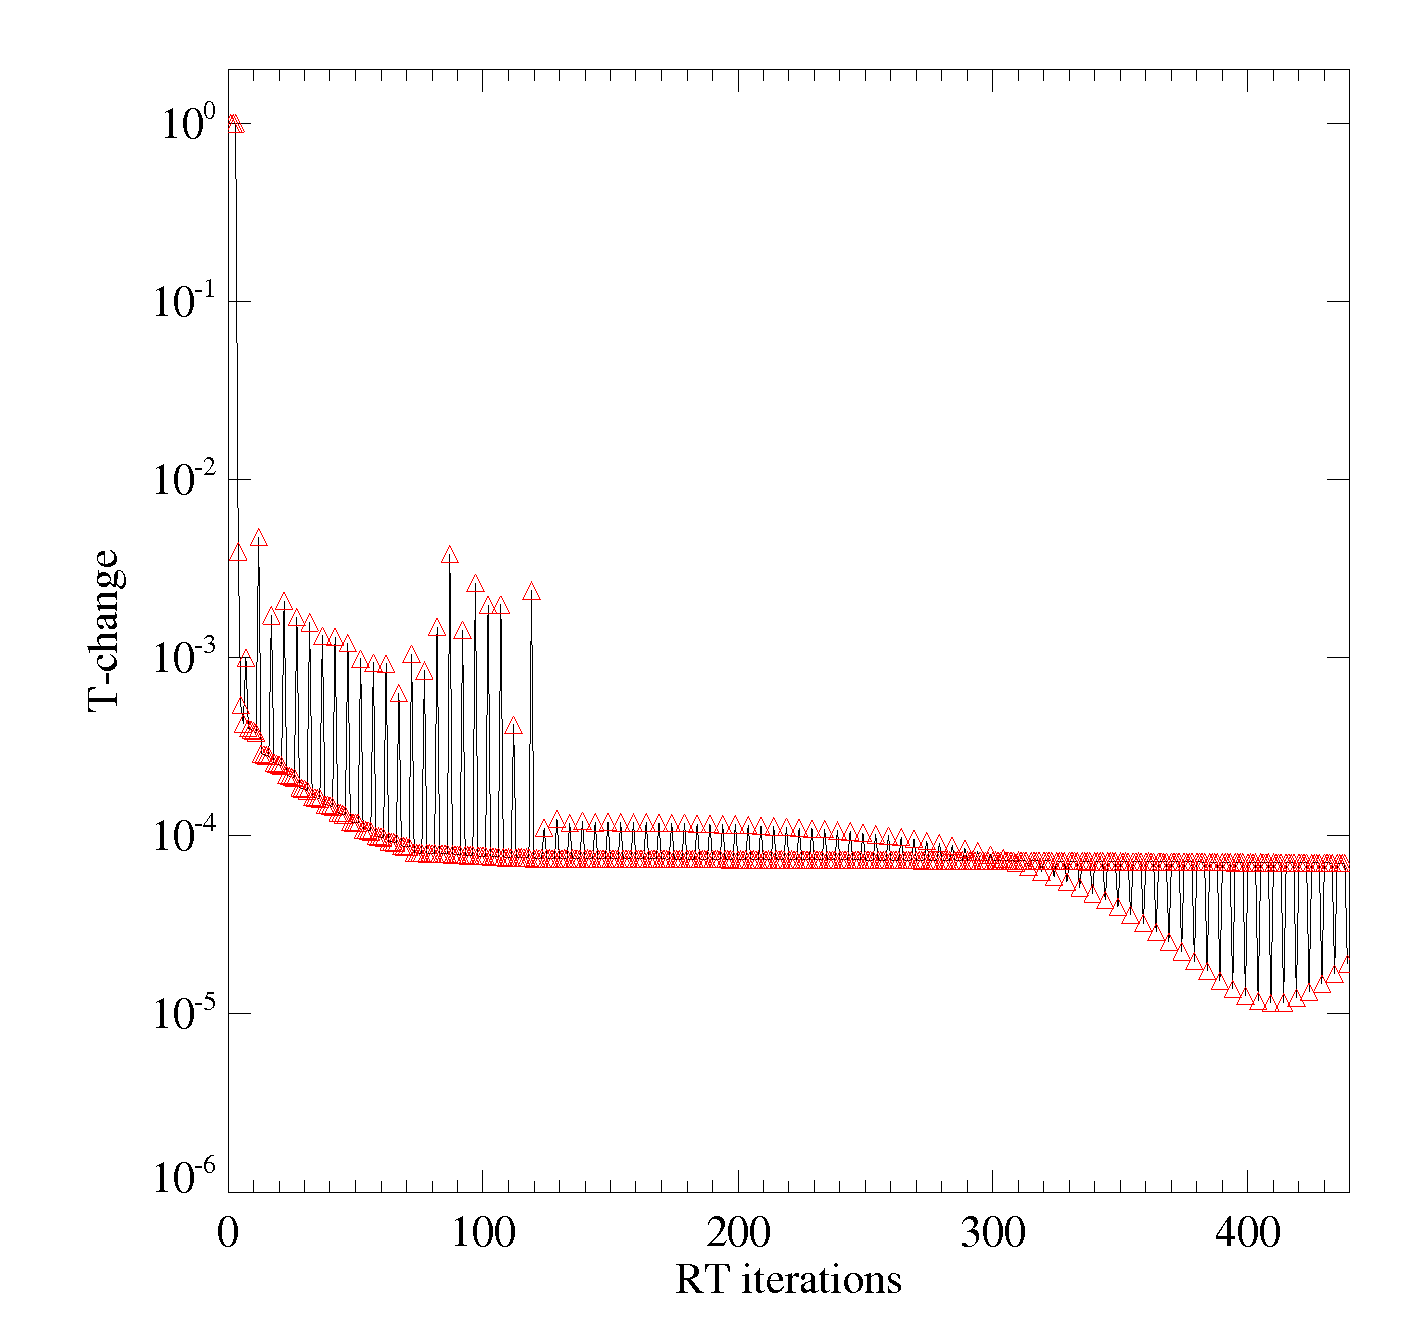
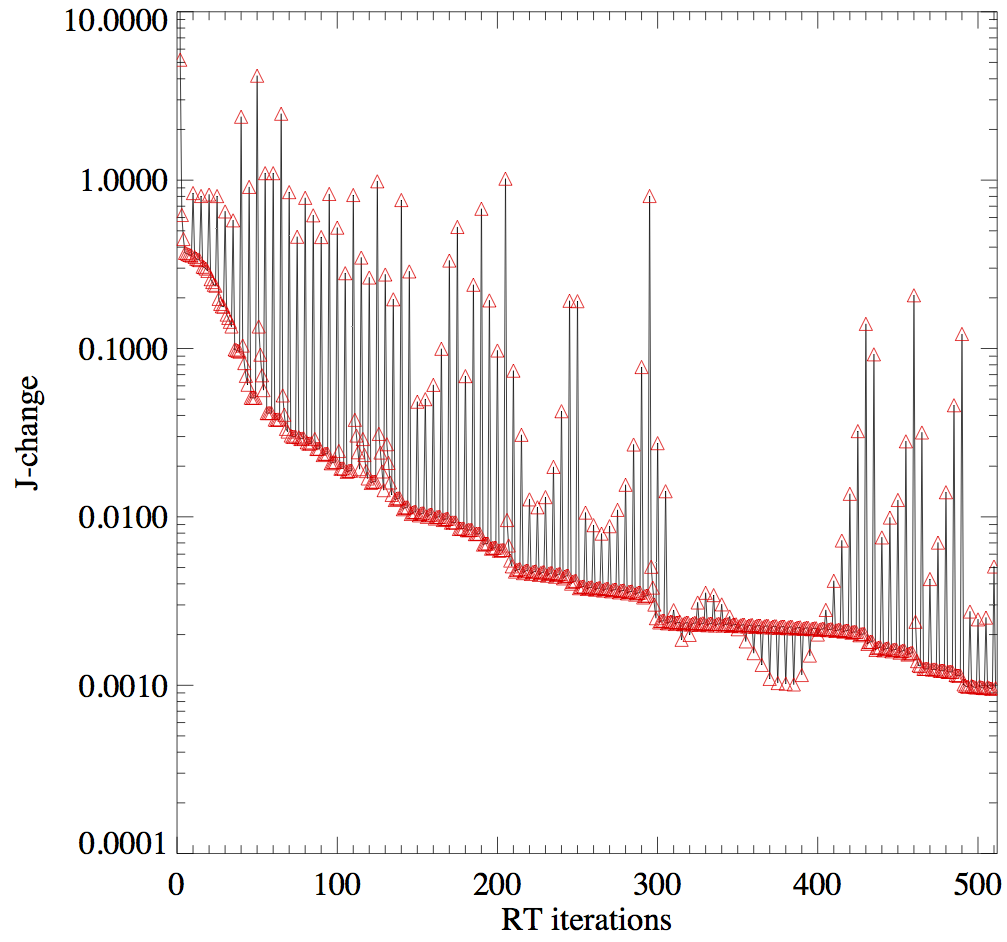
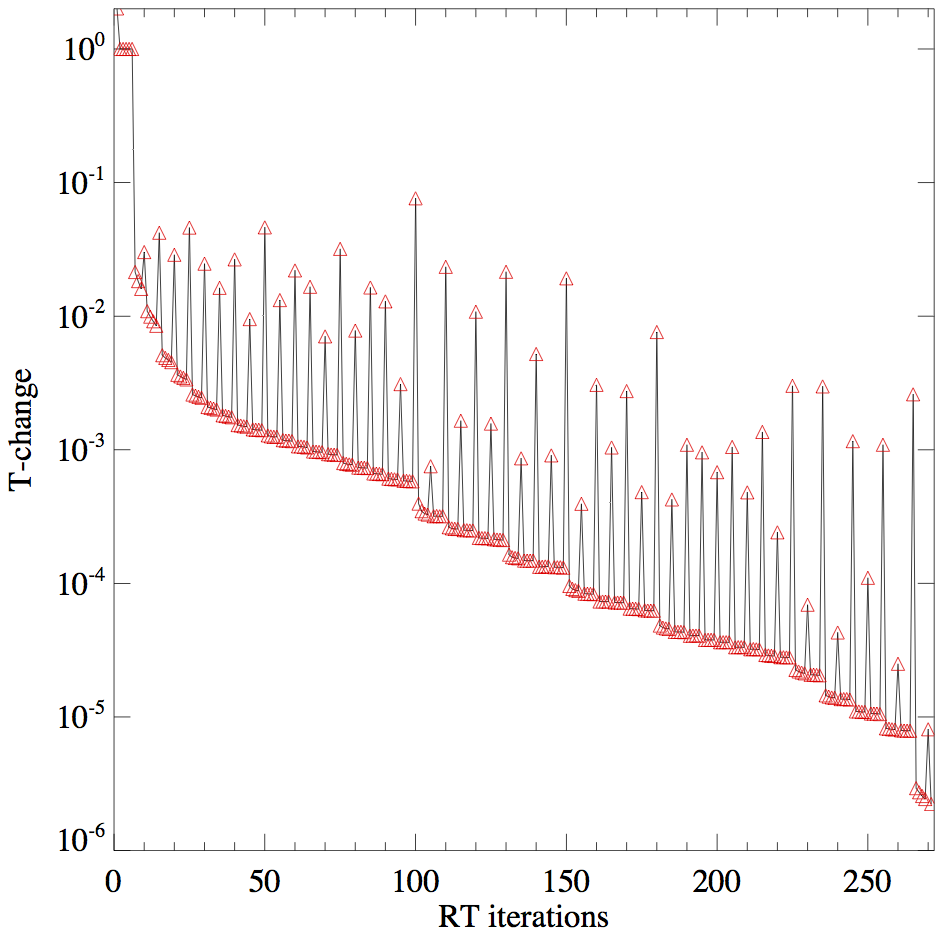
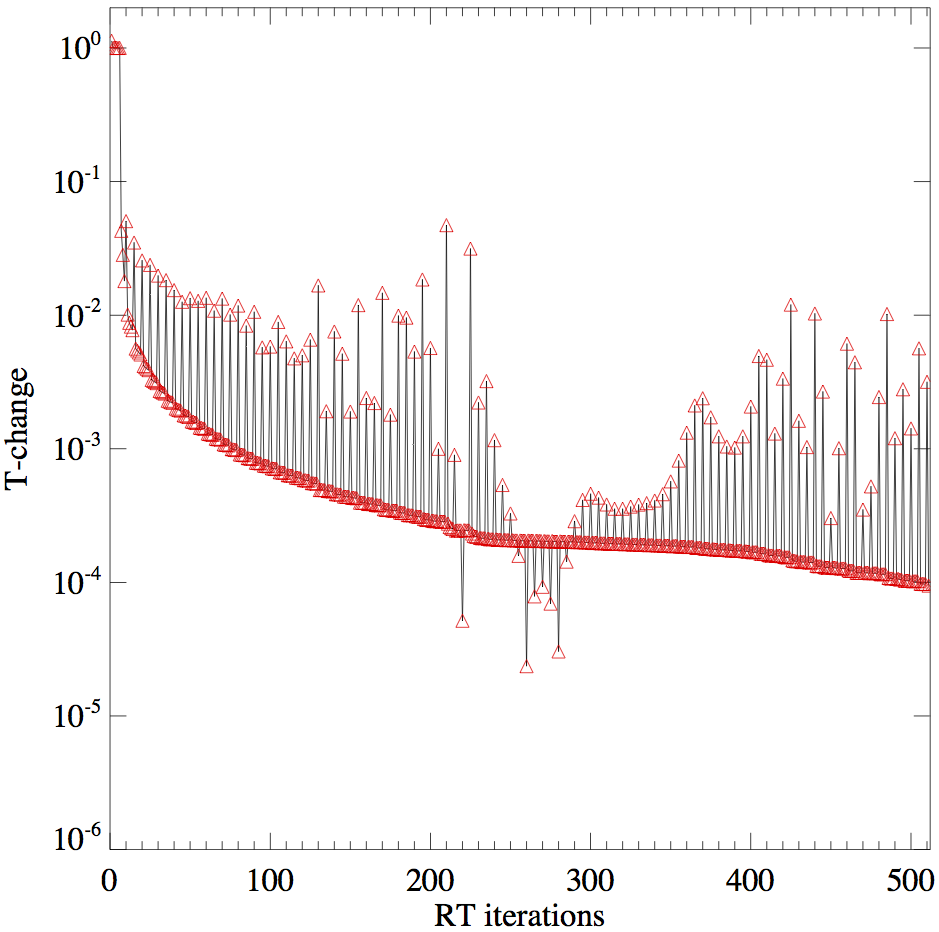
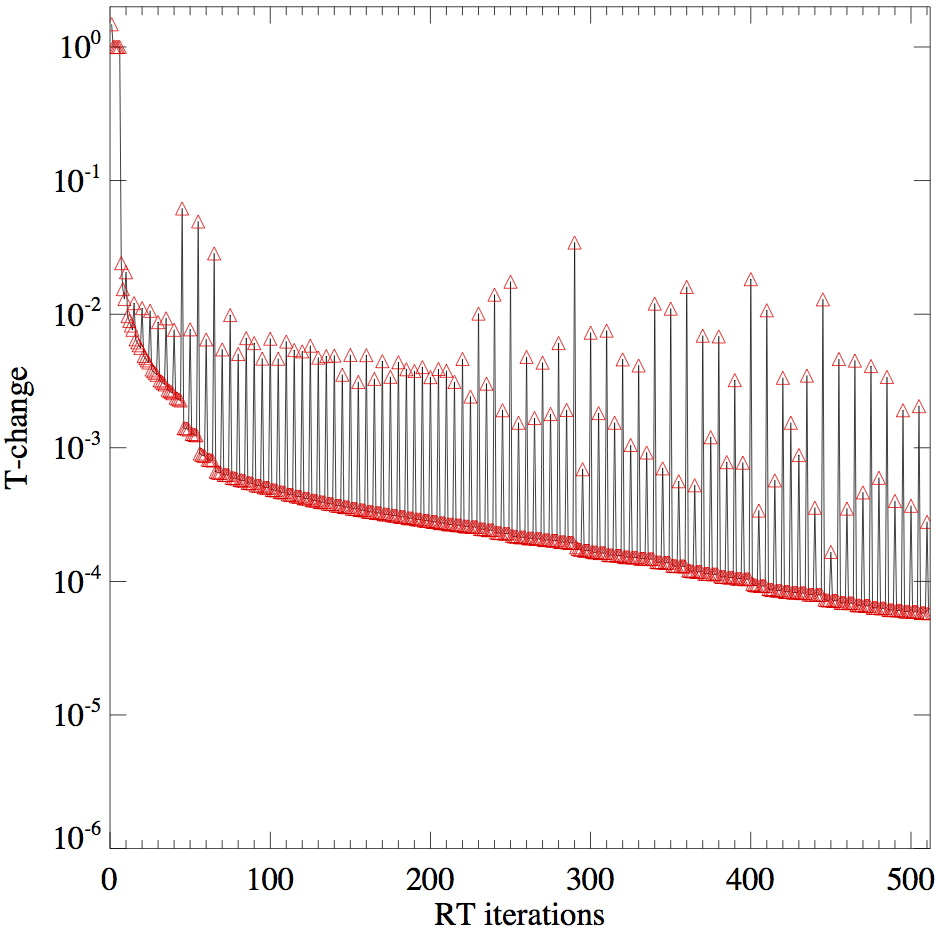
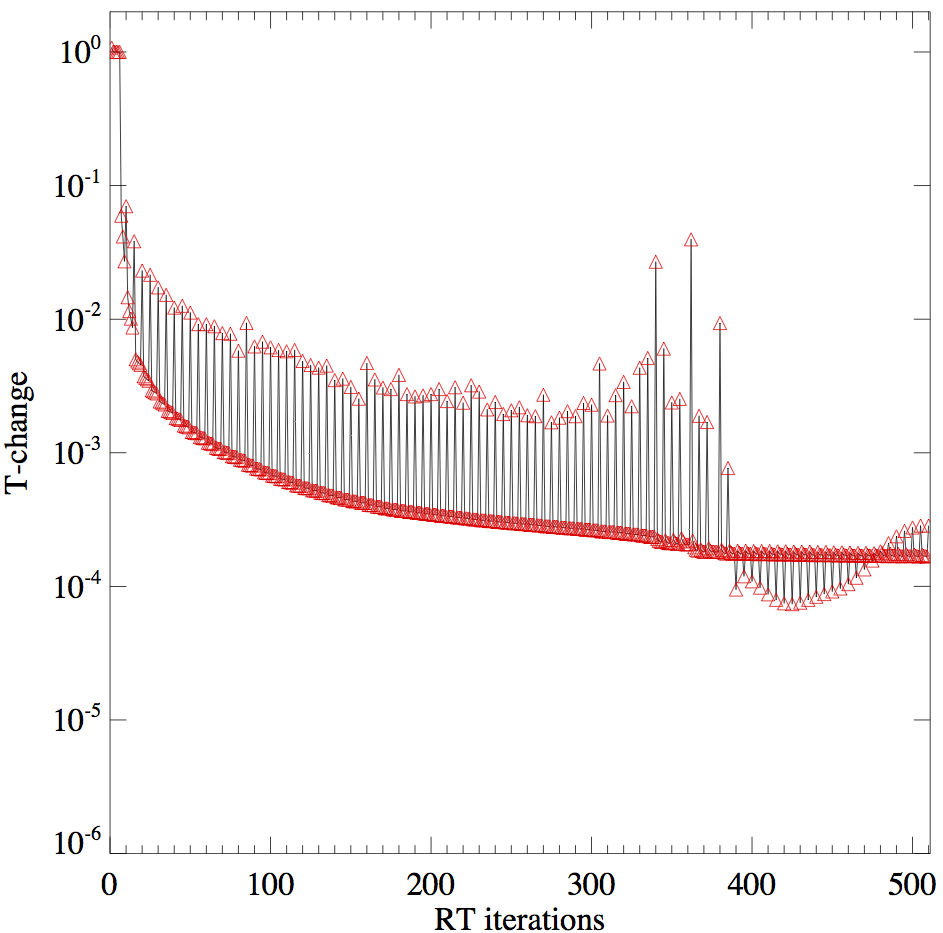
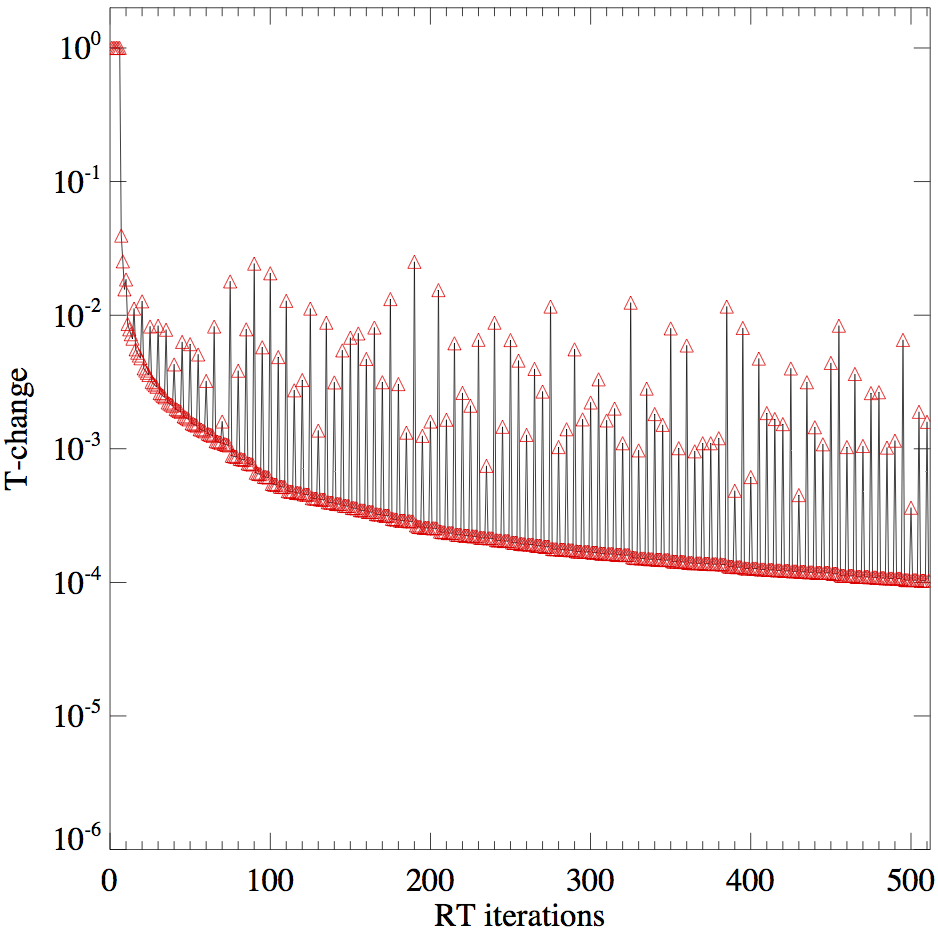
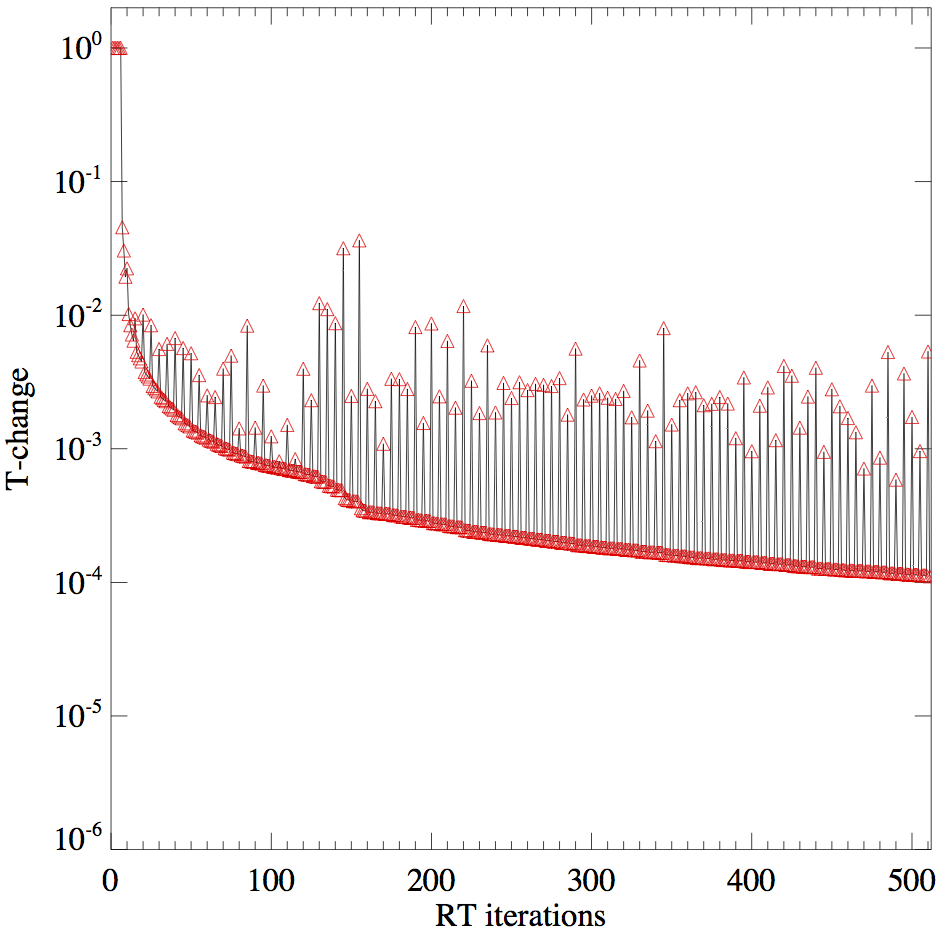
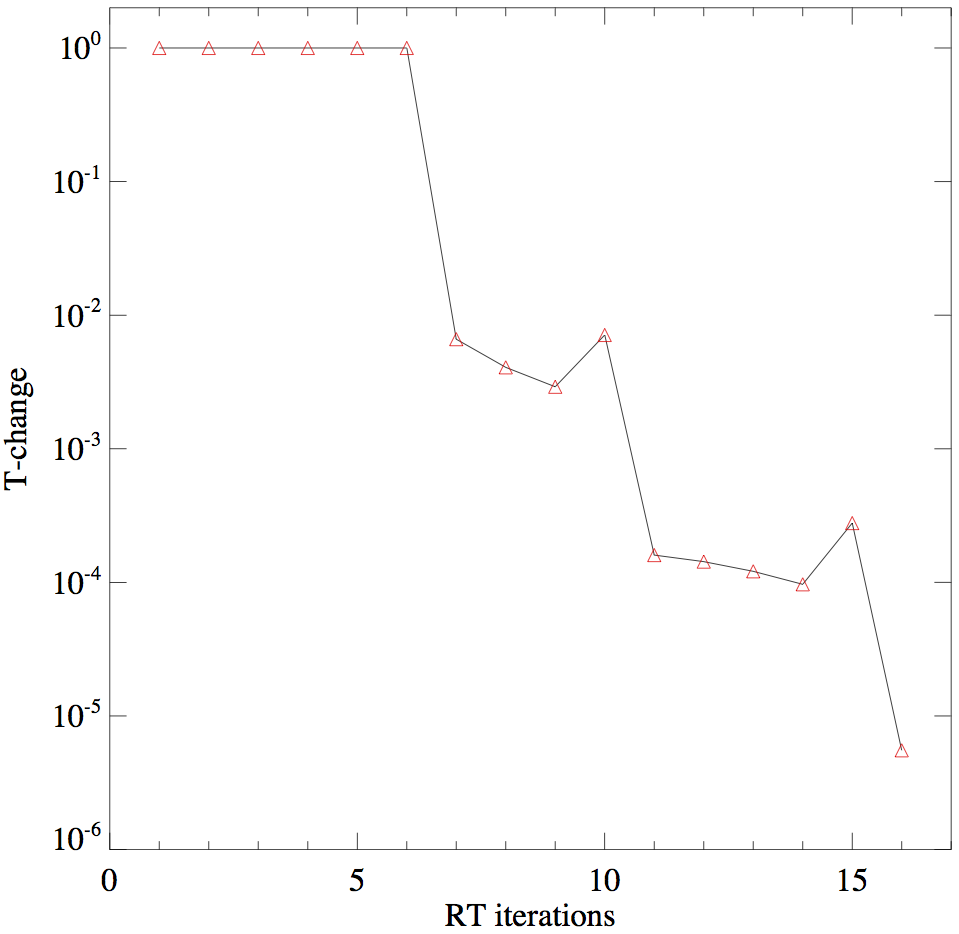
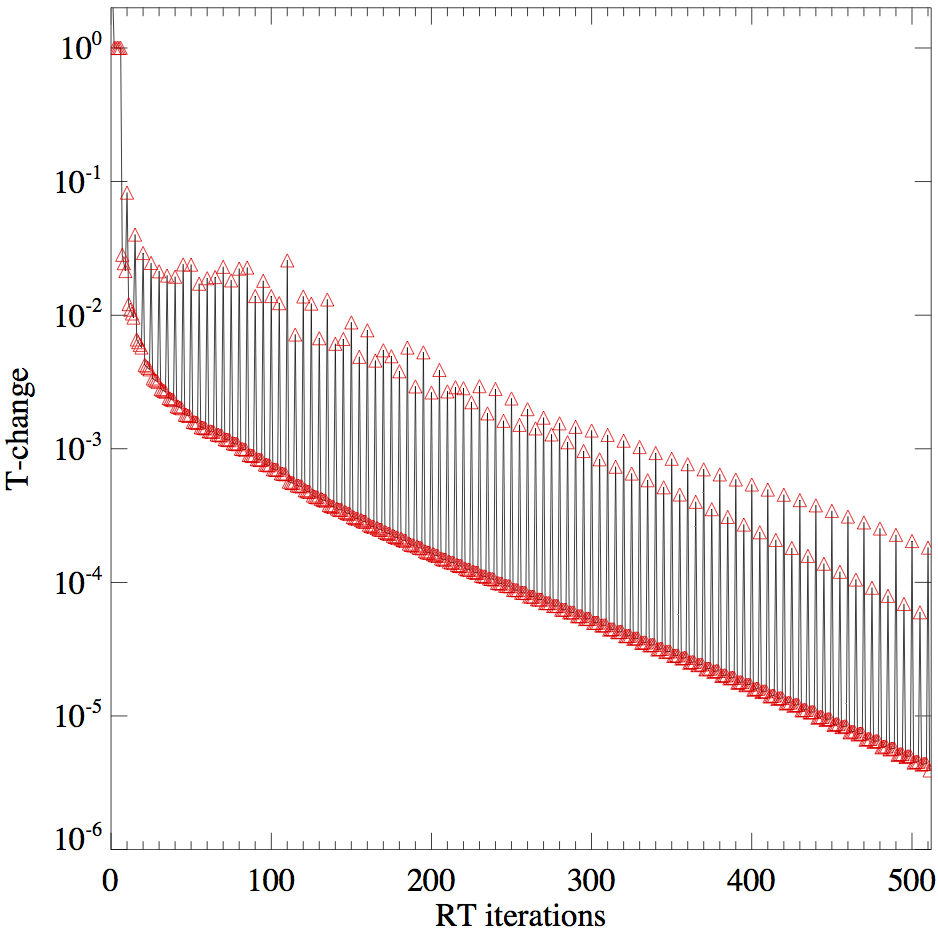
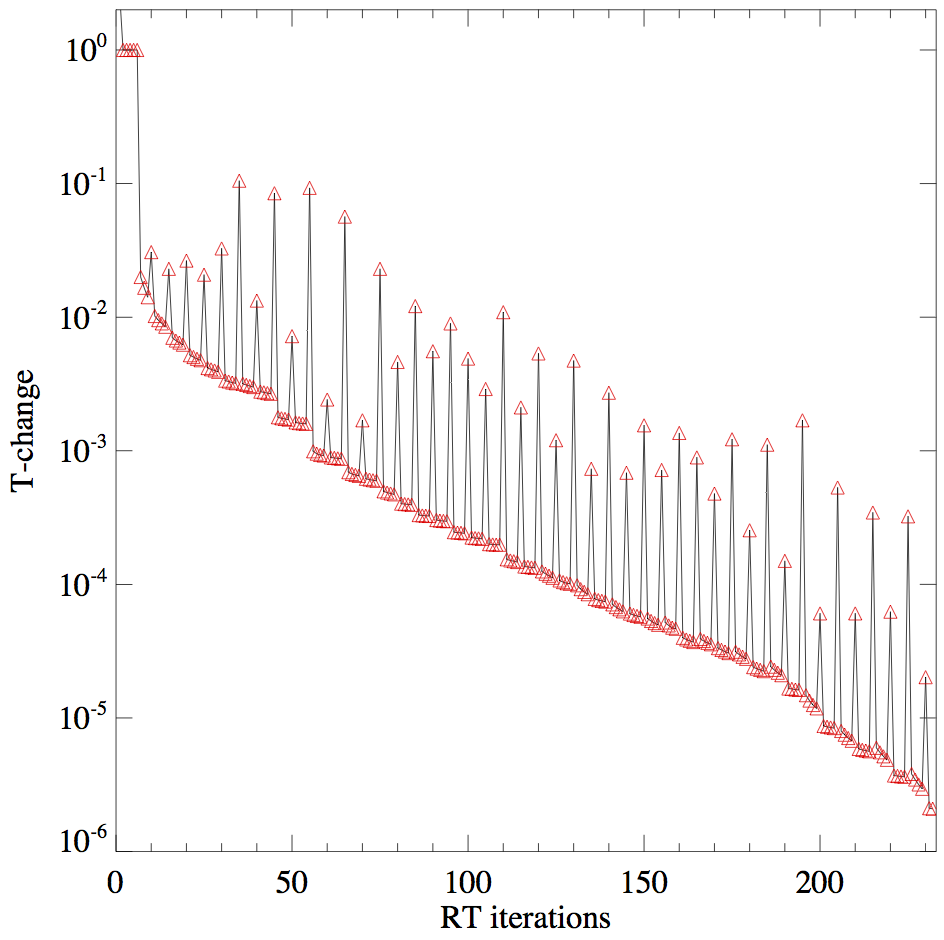
Each test case shows the Tdust-convergence, the temperature-results, and the SED-results, in comparison to MCFOST (degraded to isotropic scattering). The ProDiMo computations have been done with NXX=80, NZZ=60, NLAM=25, Ntheta=30, Nphi=30, tau_cutoff=30, and RTitmax=400. With these settings, ProDiMo calculates 80x60x(29x29+2)=4046400 rays with 25 wavelengths. On average, 54.7 spatial steps per ray are computed, and ProDiMo interpolates opacities and source functions, on average, 2.129 times per step, that's about 4.71E+8 interpolation calls per RT-iteration. On an 8-processor Linux machine, one RT-iteration takes about 170sec. The tau=1.E+3 model needed 218 RT-iterations to converge, hence altogether 11.7 hours of user time (90.0 CPU hours).
Click on the images to see something ...
tau = 1.E+3
 |
 |
 |
 |
tau = 1.E+4
 |
 |
 |
 |
tau = 1.E+5
 |
 |
 |
 |
tau = 1.E+6
 |
 |
 |
 |
The following table shows the maximum and mean (standard-deviation) dust temperature and SED-flux deviations:
| tau | mean T-dev. | max.T-dev. | mean SED-dev. | max.SED-dev |
|---|---|---|---|---|
| 1.E+3 | 2.1% | 10.9% | 4.0% | 10.9% |
| 1.E+4 | 4.4% | 24.1% | 6.1% | 15.7% |
| 1.E+5 | 7.2% | 32.4% | 7.2% | 24.0% |
| 1.E+6 | 5.9% | 17.1% | 9.8% | 30.2% |
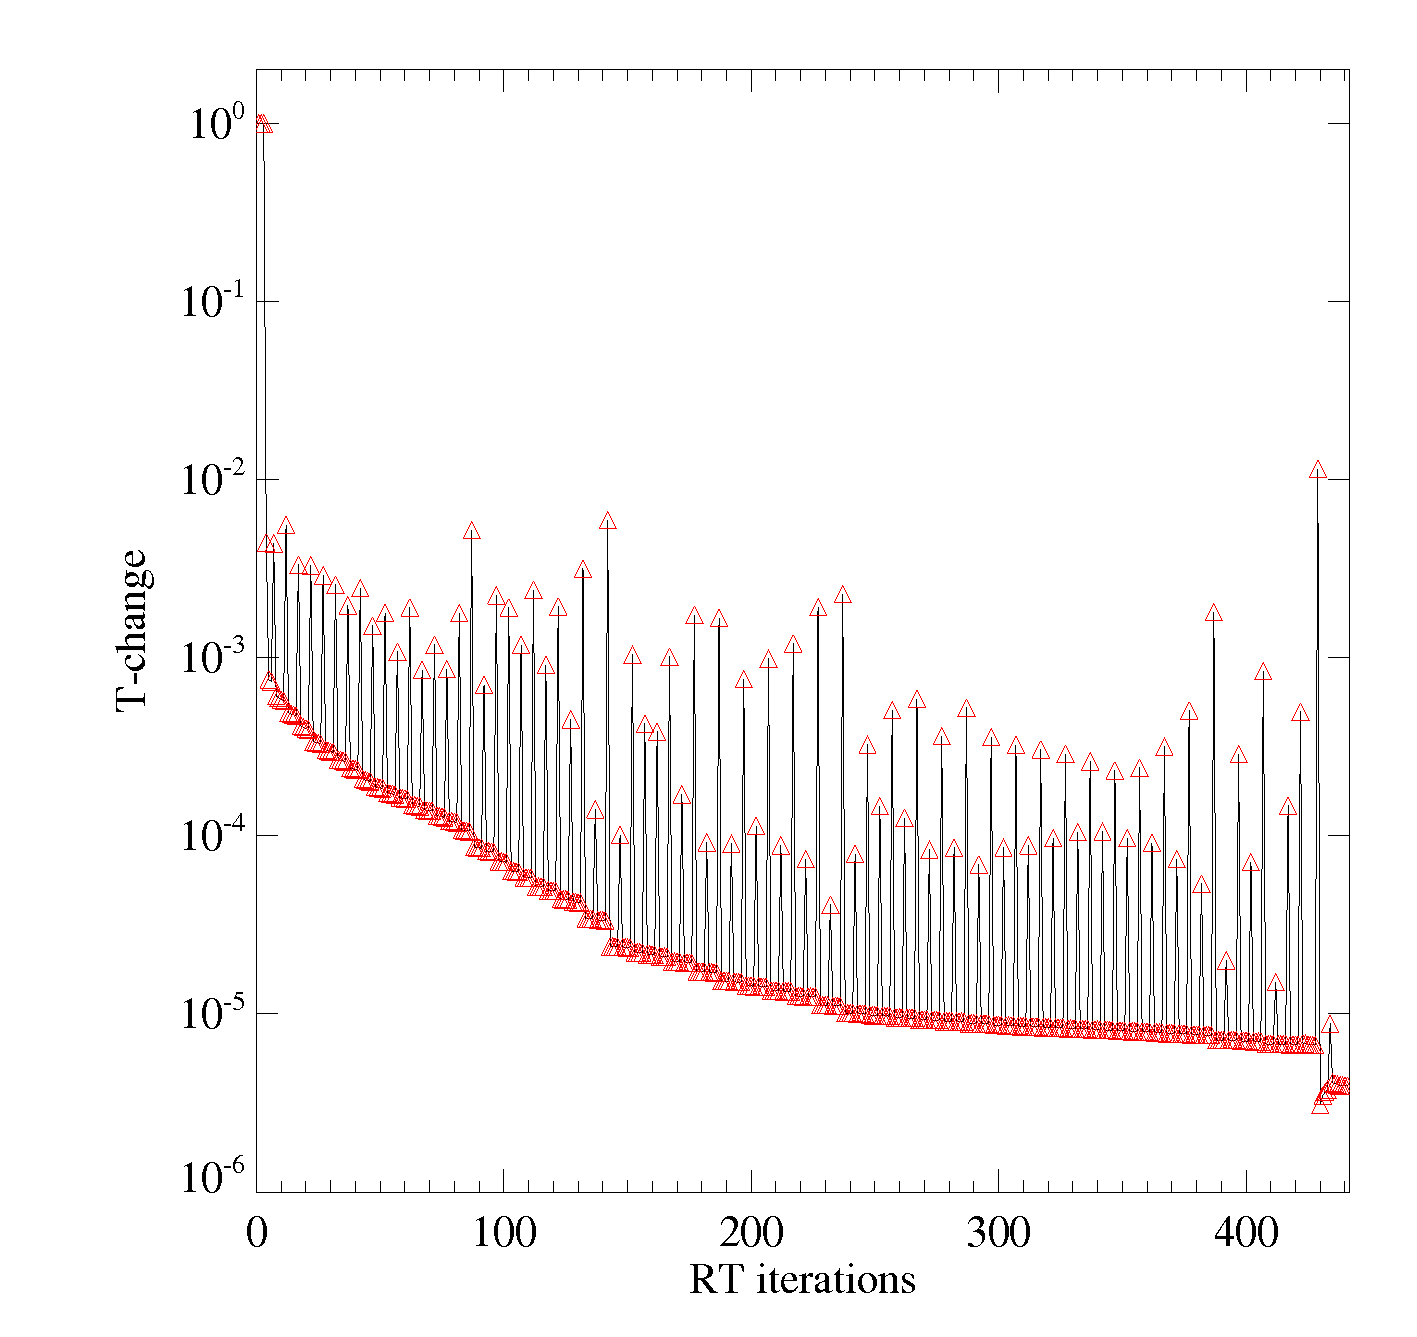
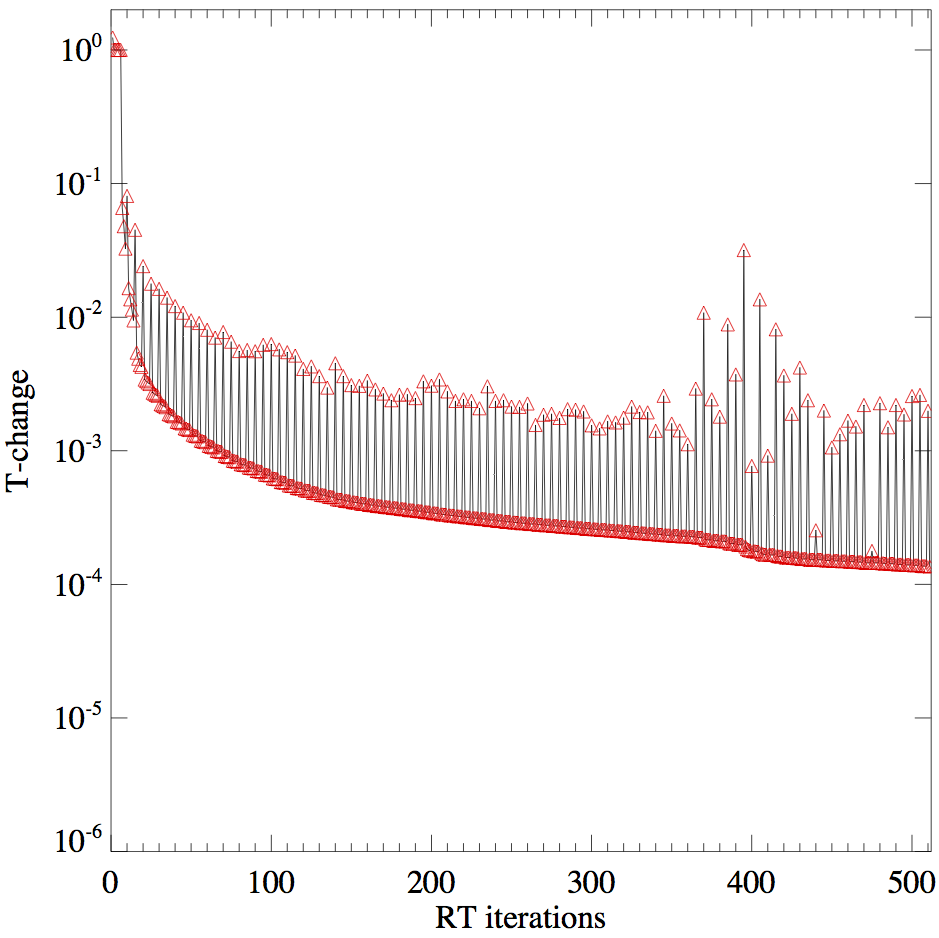
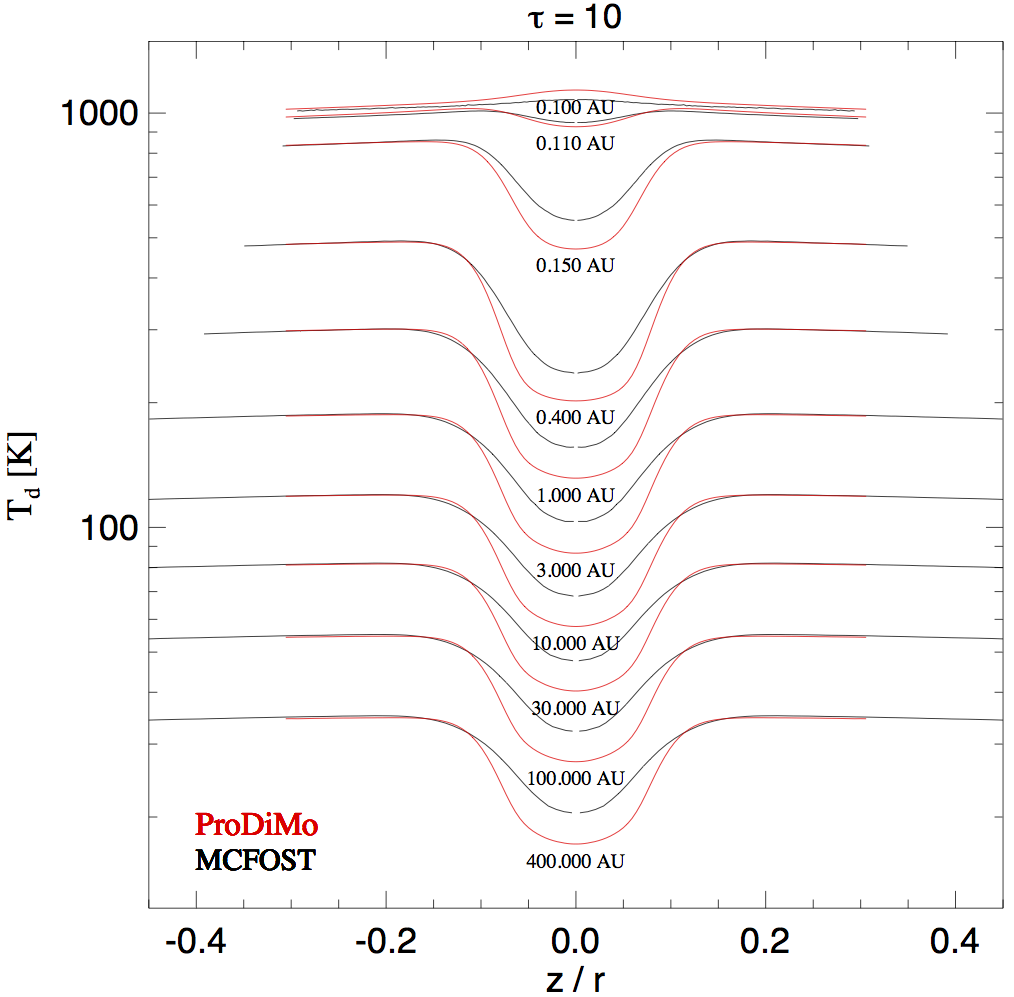
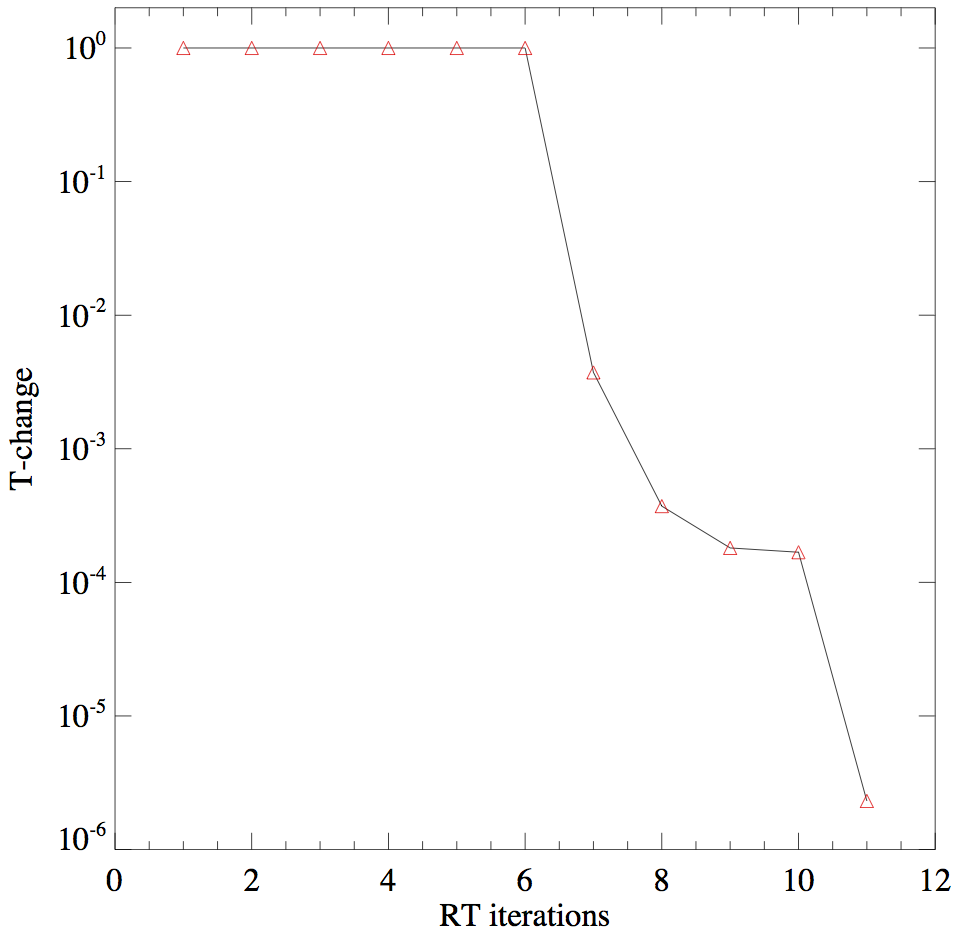
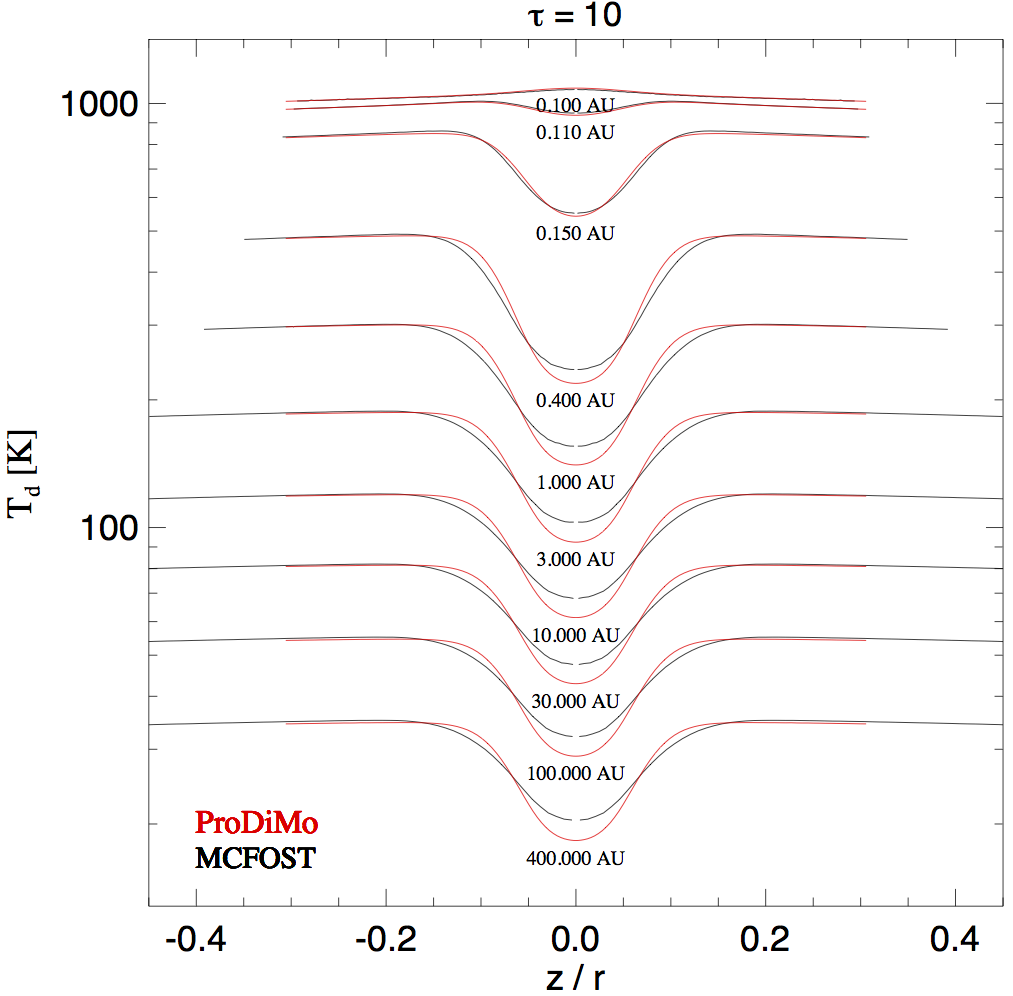
The convergence-plots show that only the tau=1.E+3 test case has properly converged. The tau=1.E+4 and tau=1.E+5 cases have almost converged (required condition here was T-change<1.E-5 and Jnu-change<1.E-4). The tau=1.E+6 case did not converge within 400 RT-iterations.
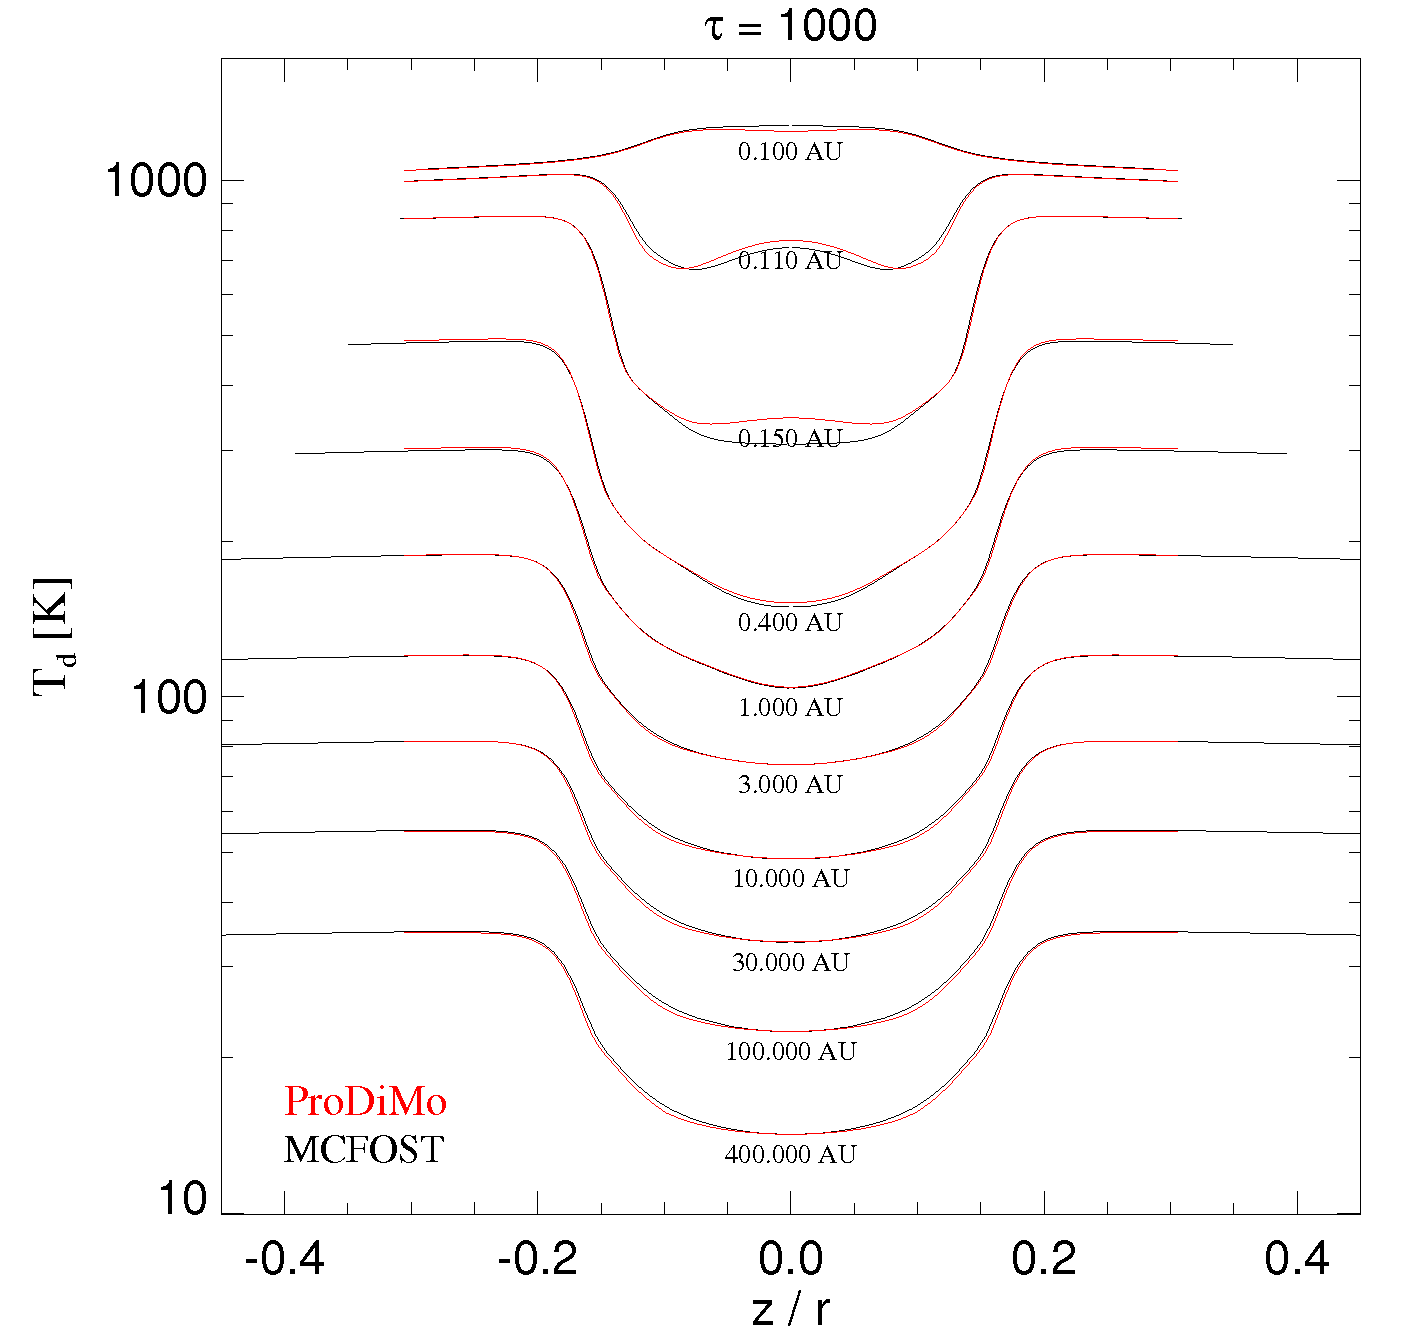
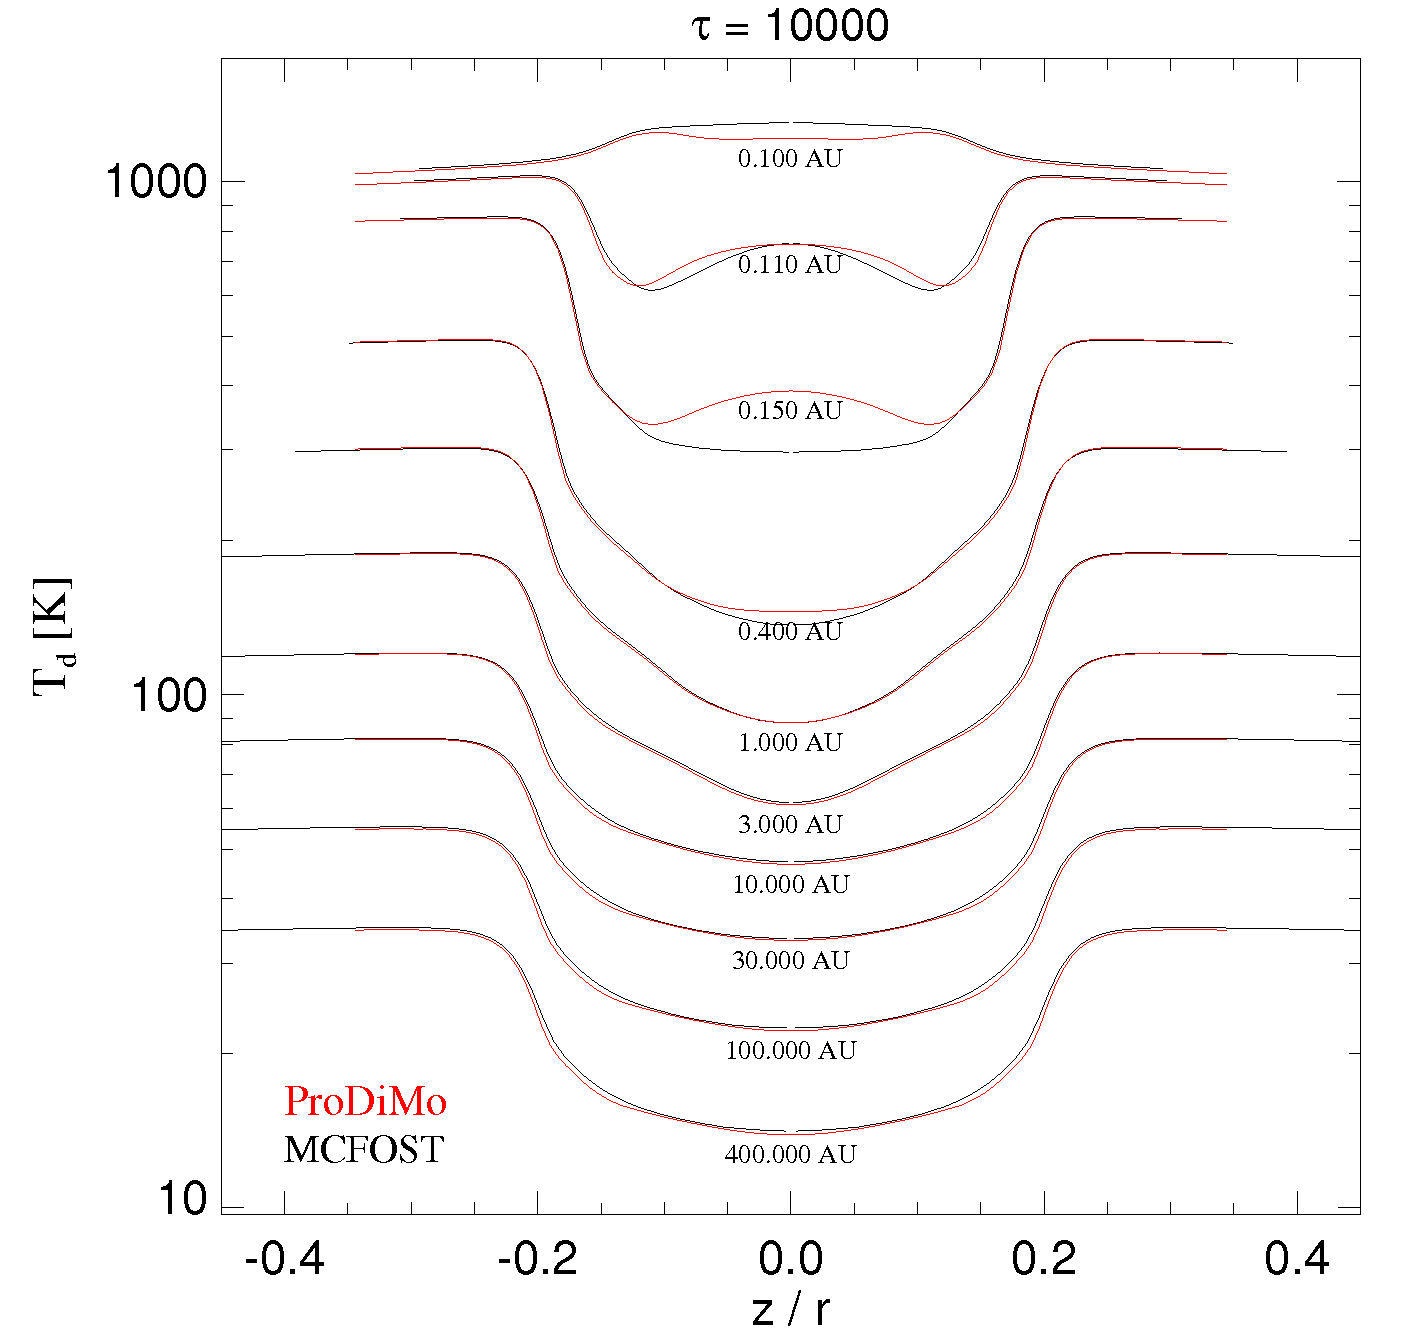
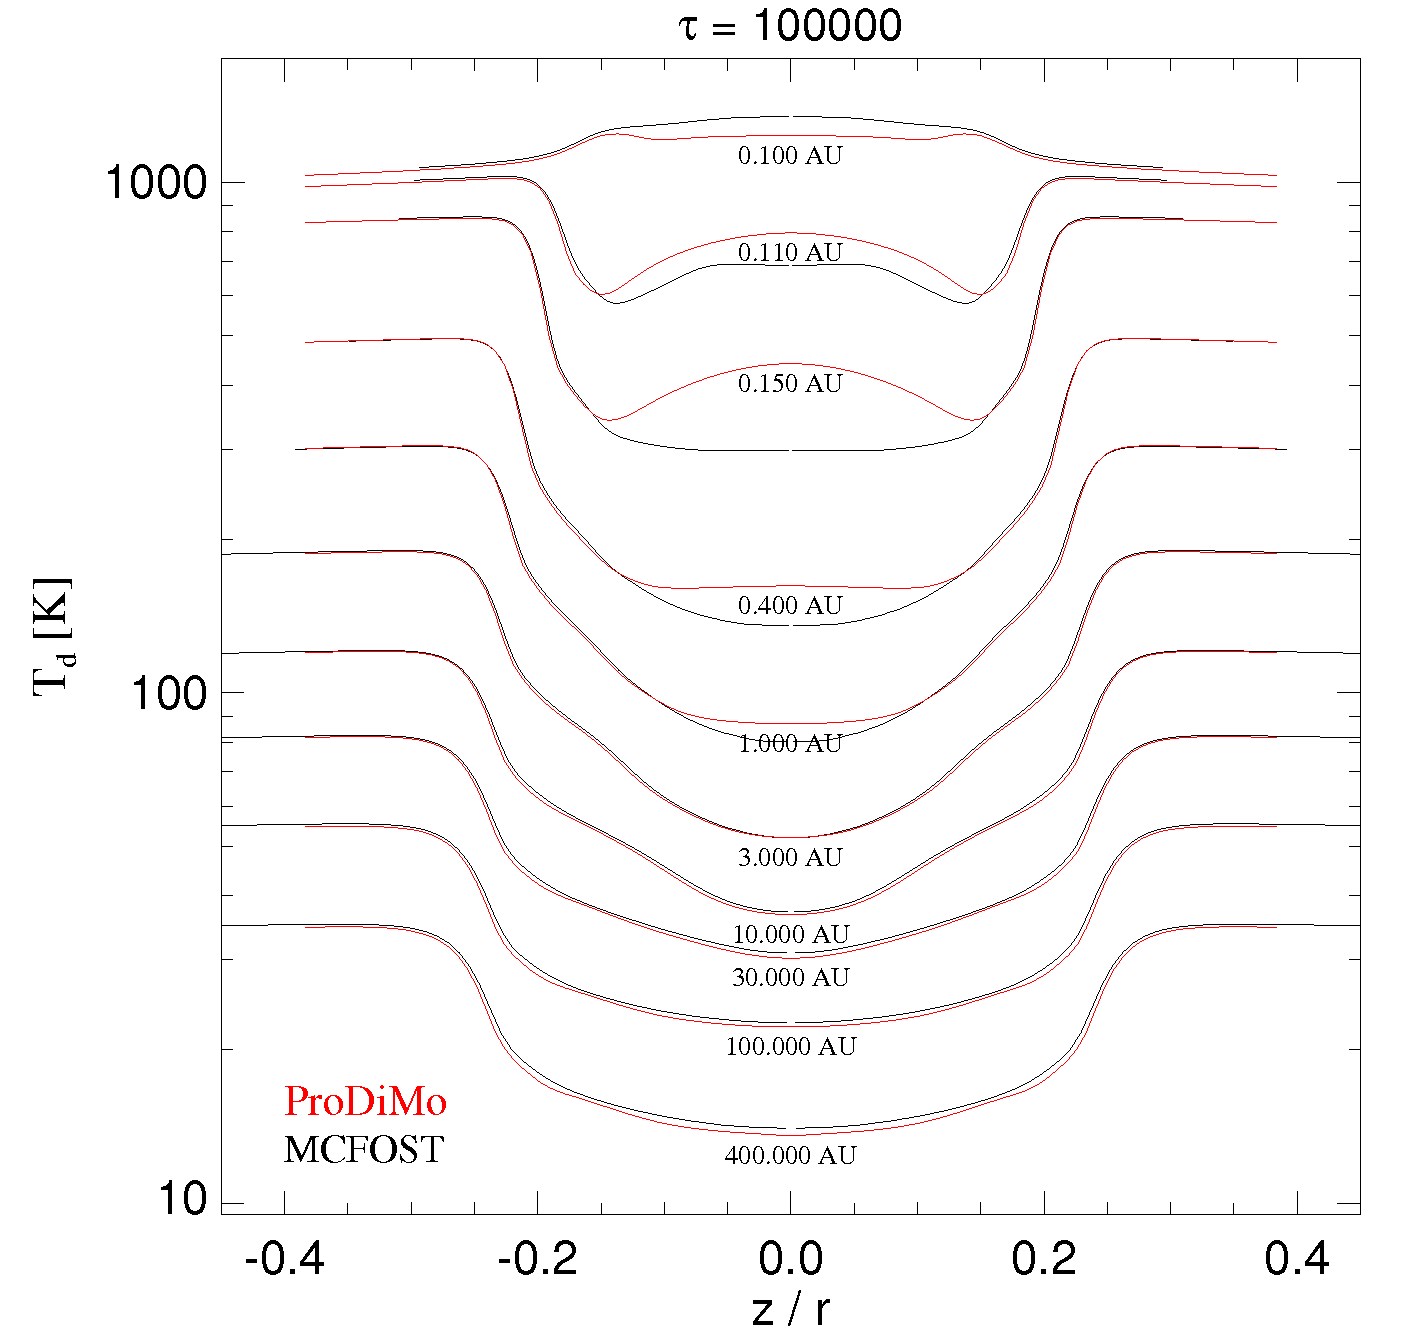
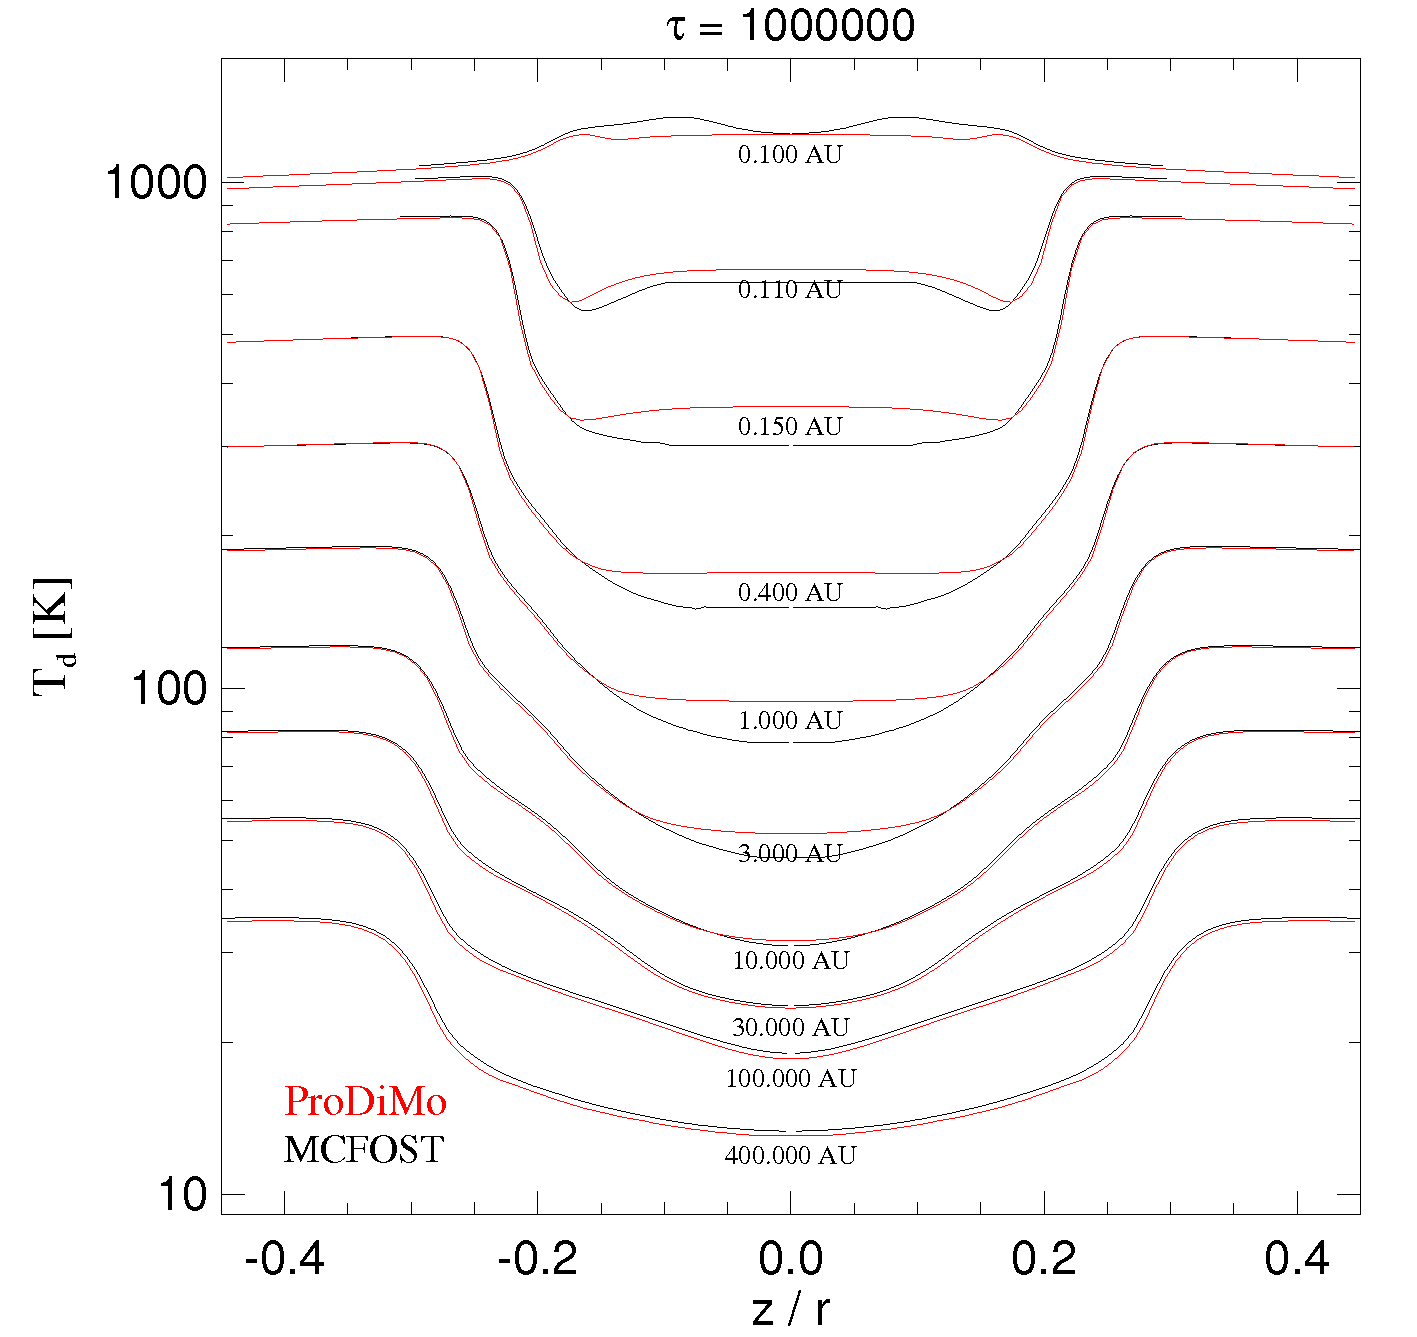
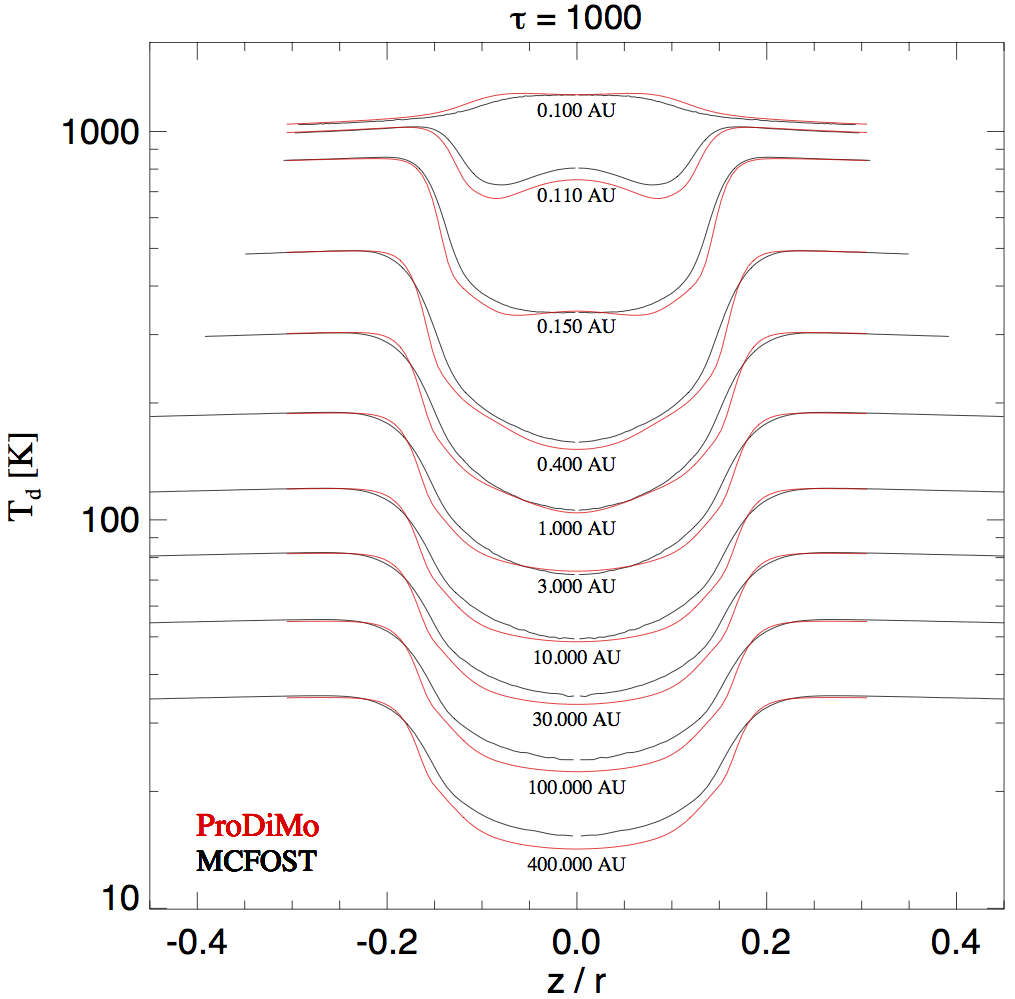
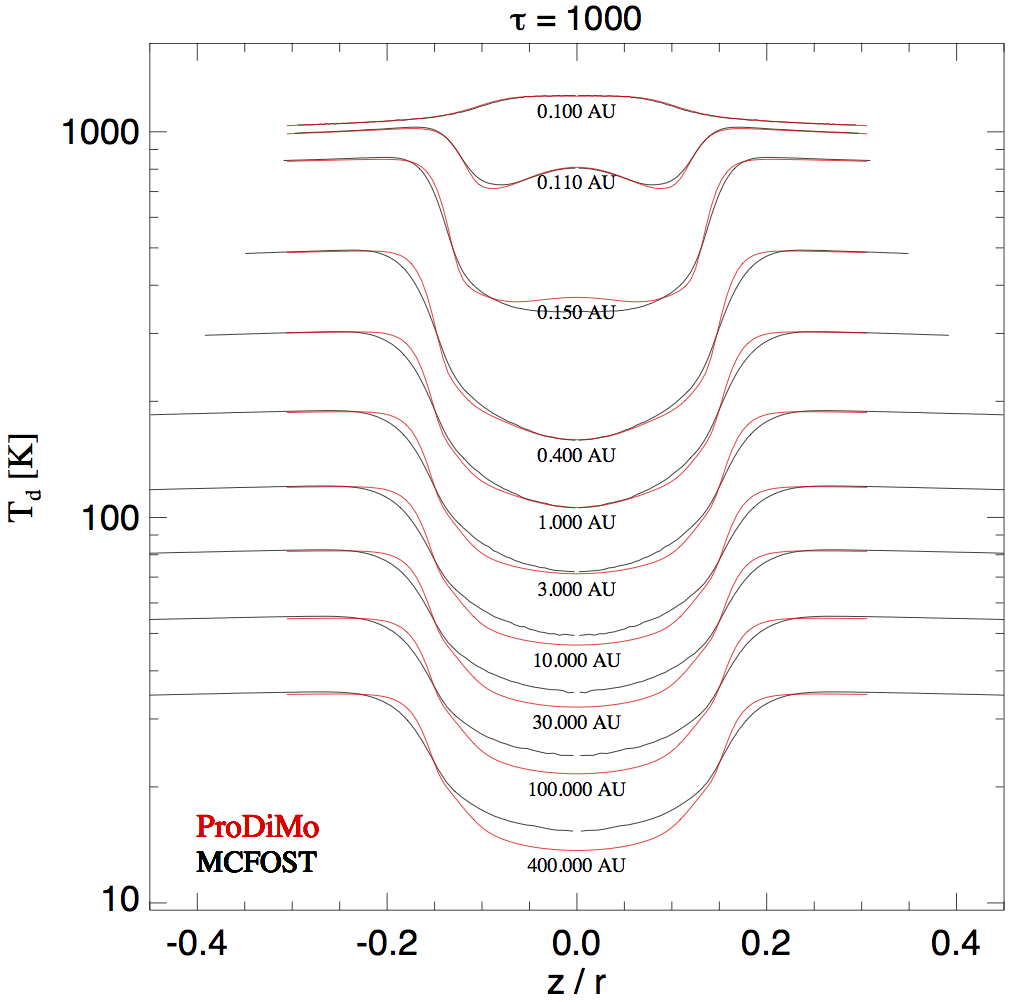
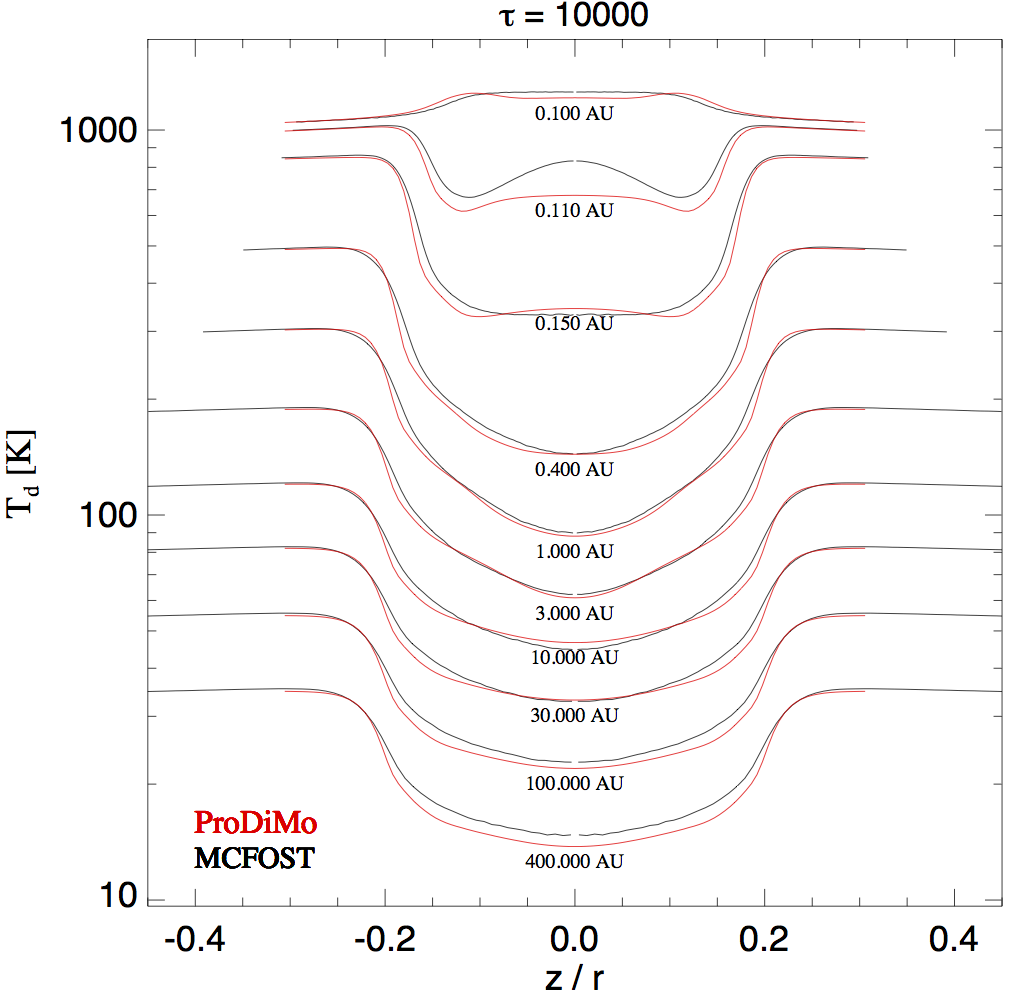
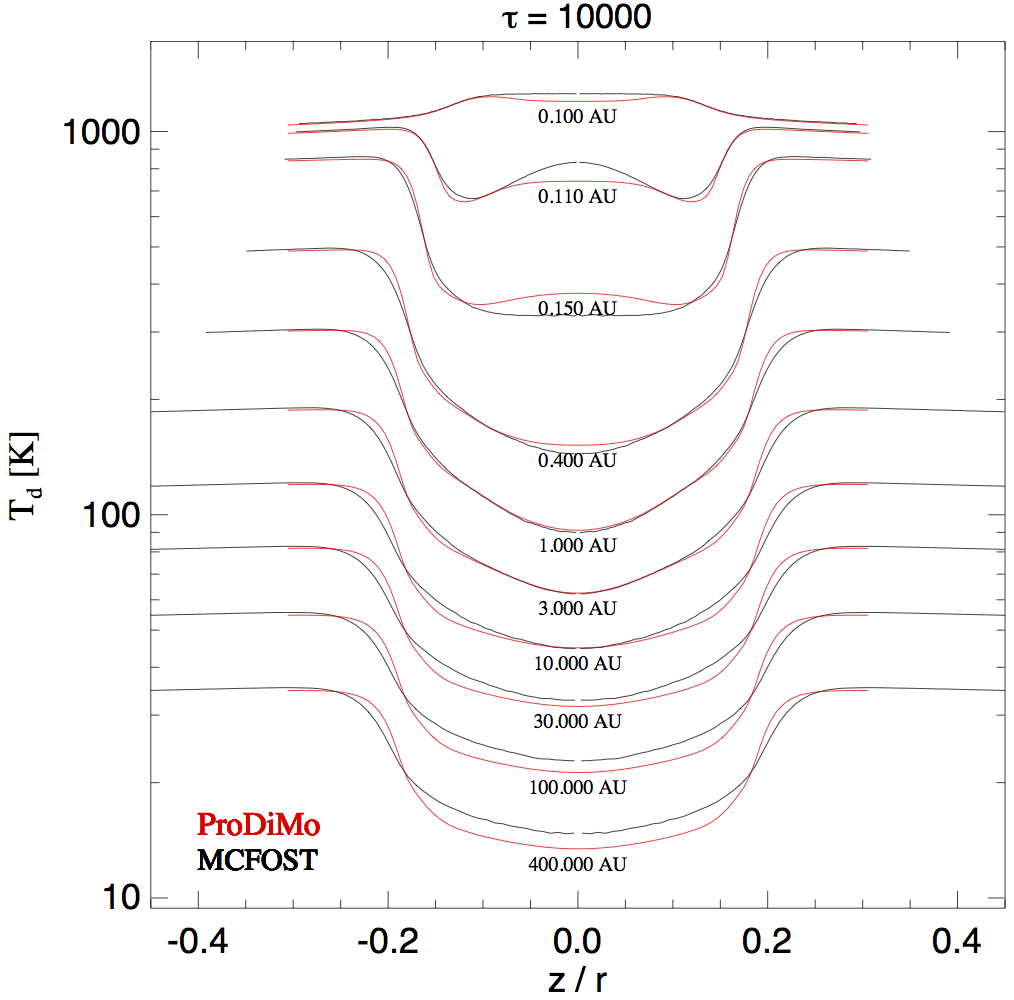
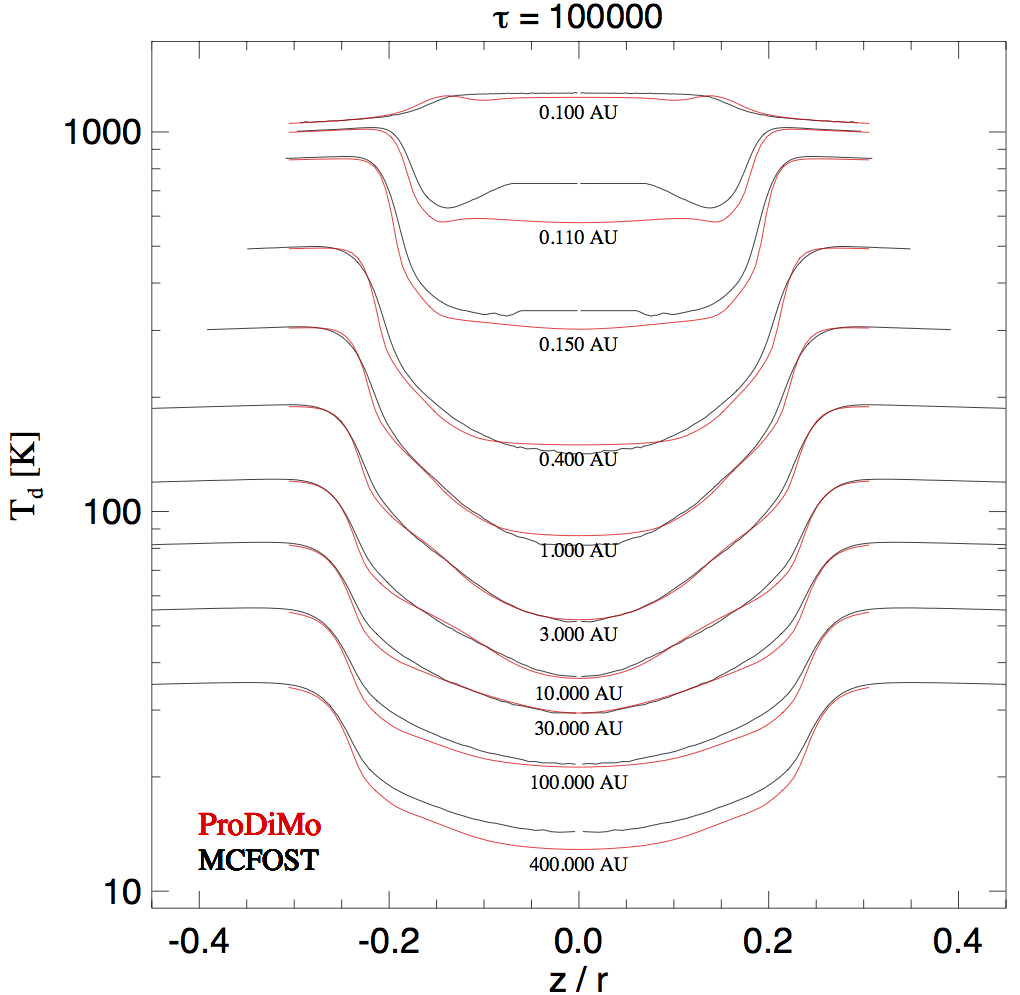
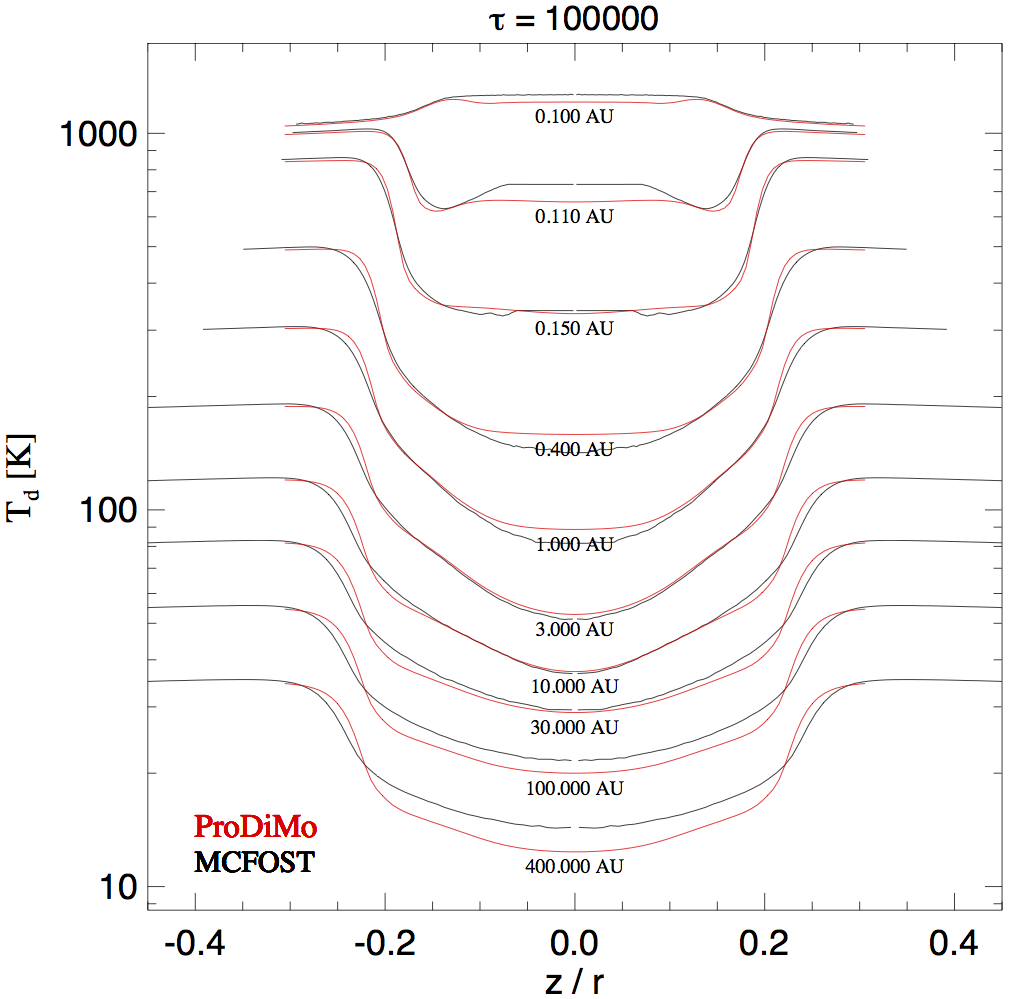
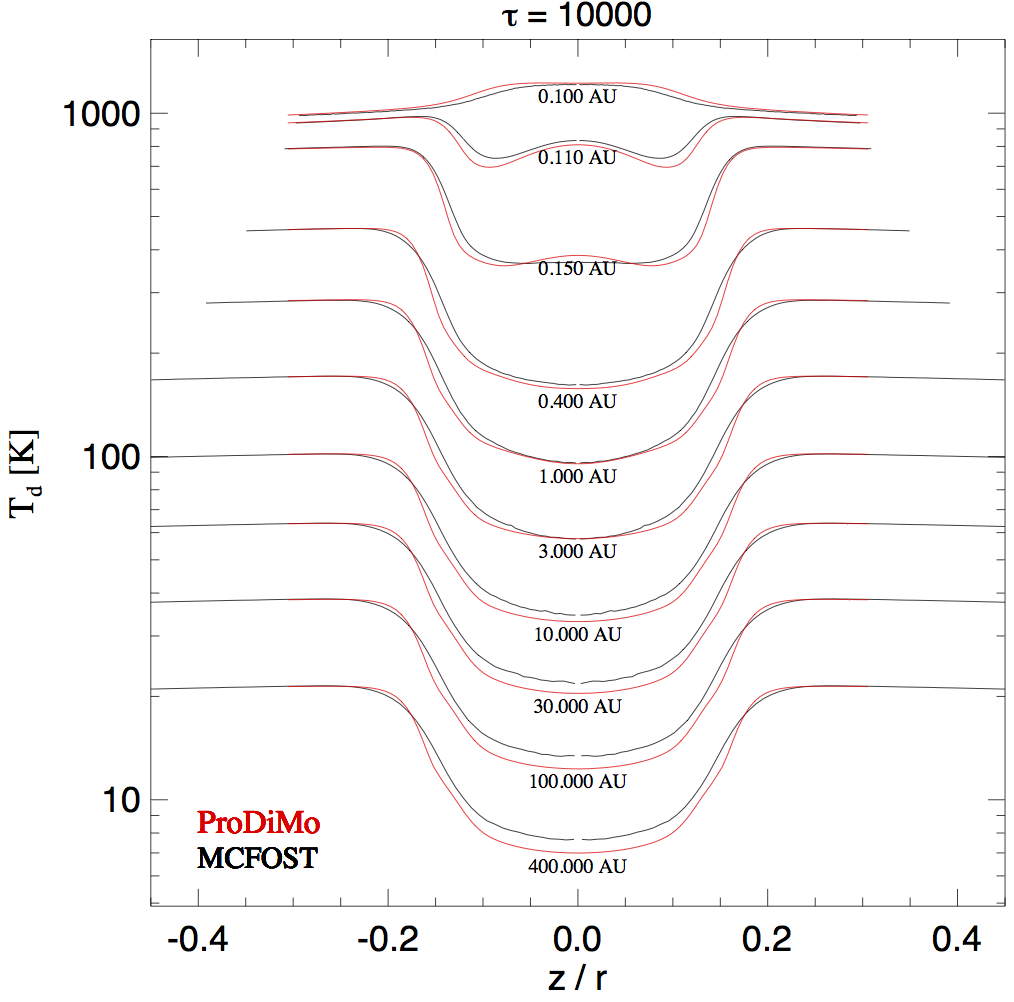
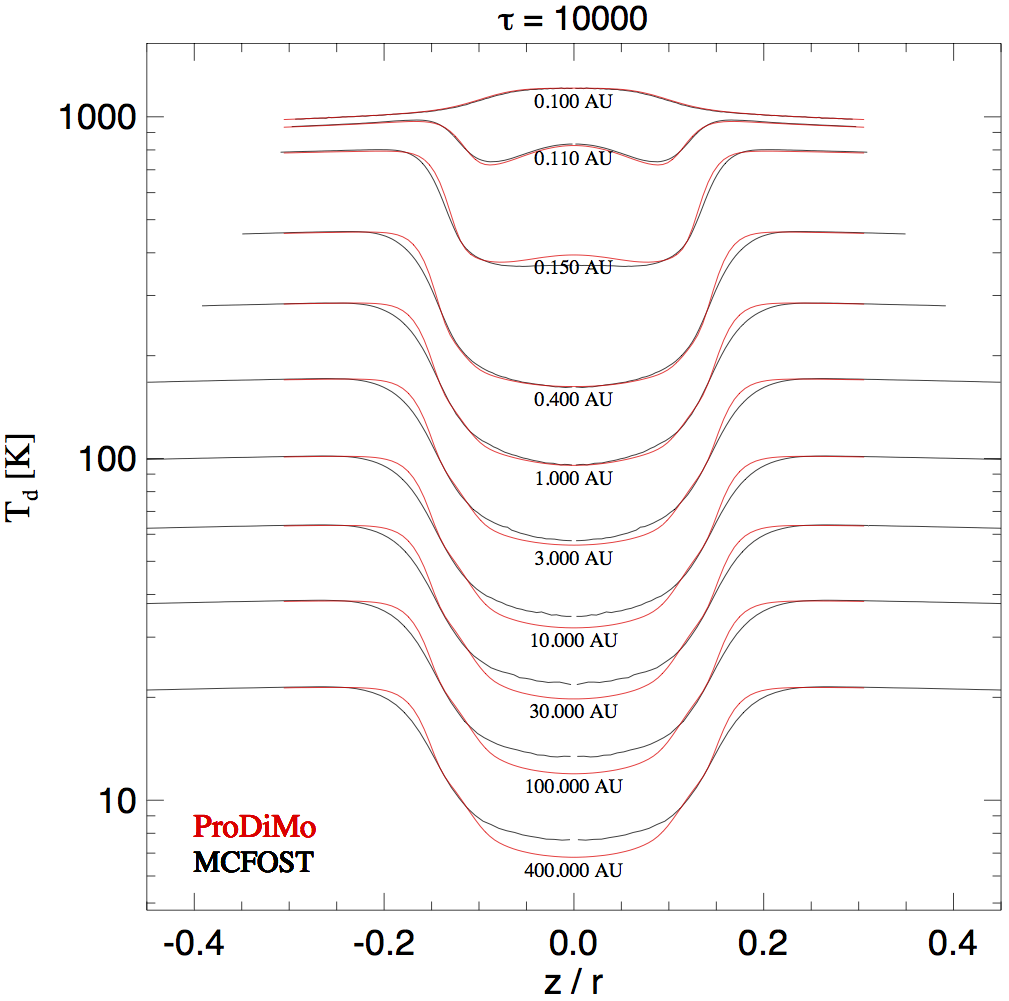
The temperature plots show that outside of the regions of reduced opacities (the "tricked" regions), i.e. in the optically thin regions and in the transition regions toward the optically thick midplane, the agreement with MCFOST is excellent, whereas in the close and deep midplane regions, ProDiMo's temperatures are somewhat too high (type 1 deviation). Also, the temperature at the inner rim is somewhat too low (type 2 deviation).
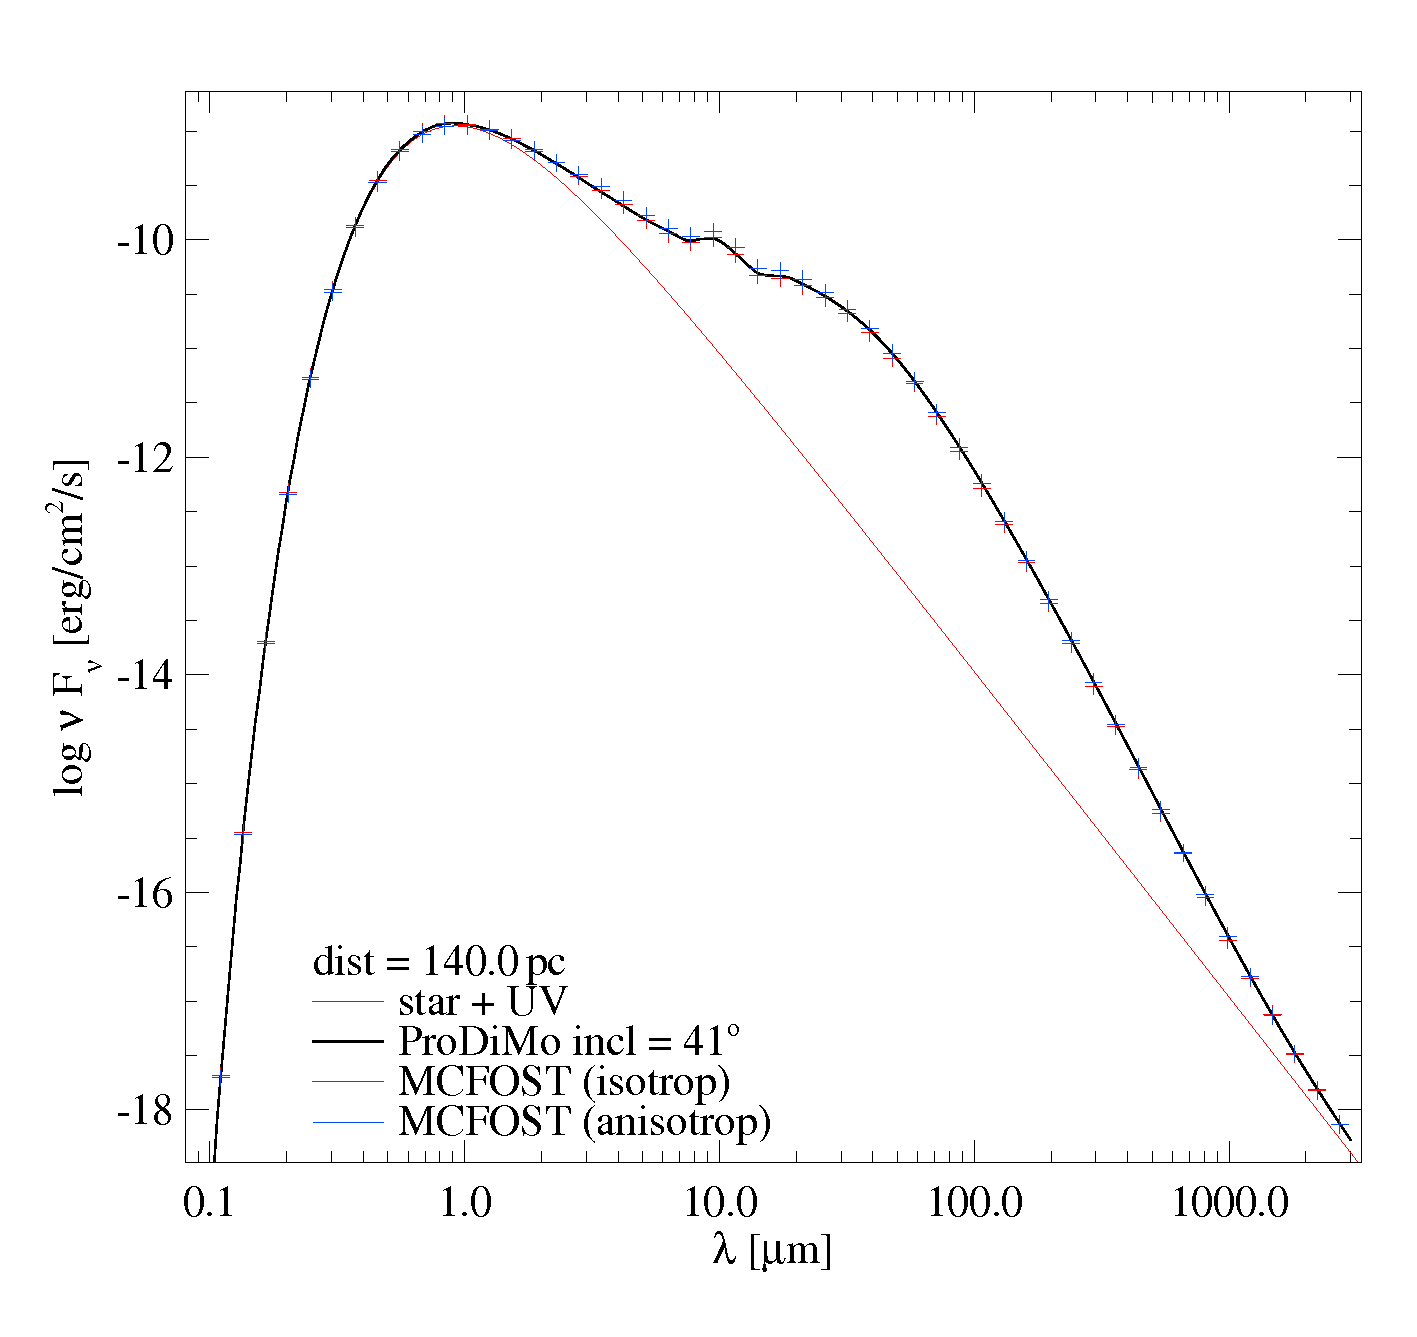
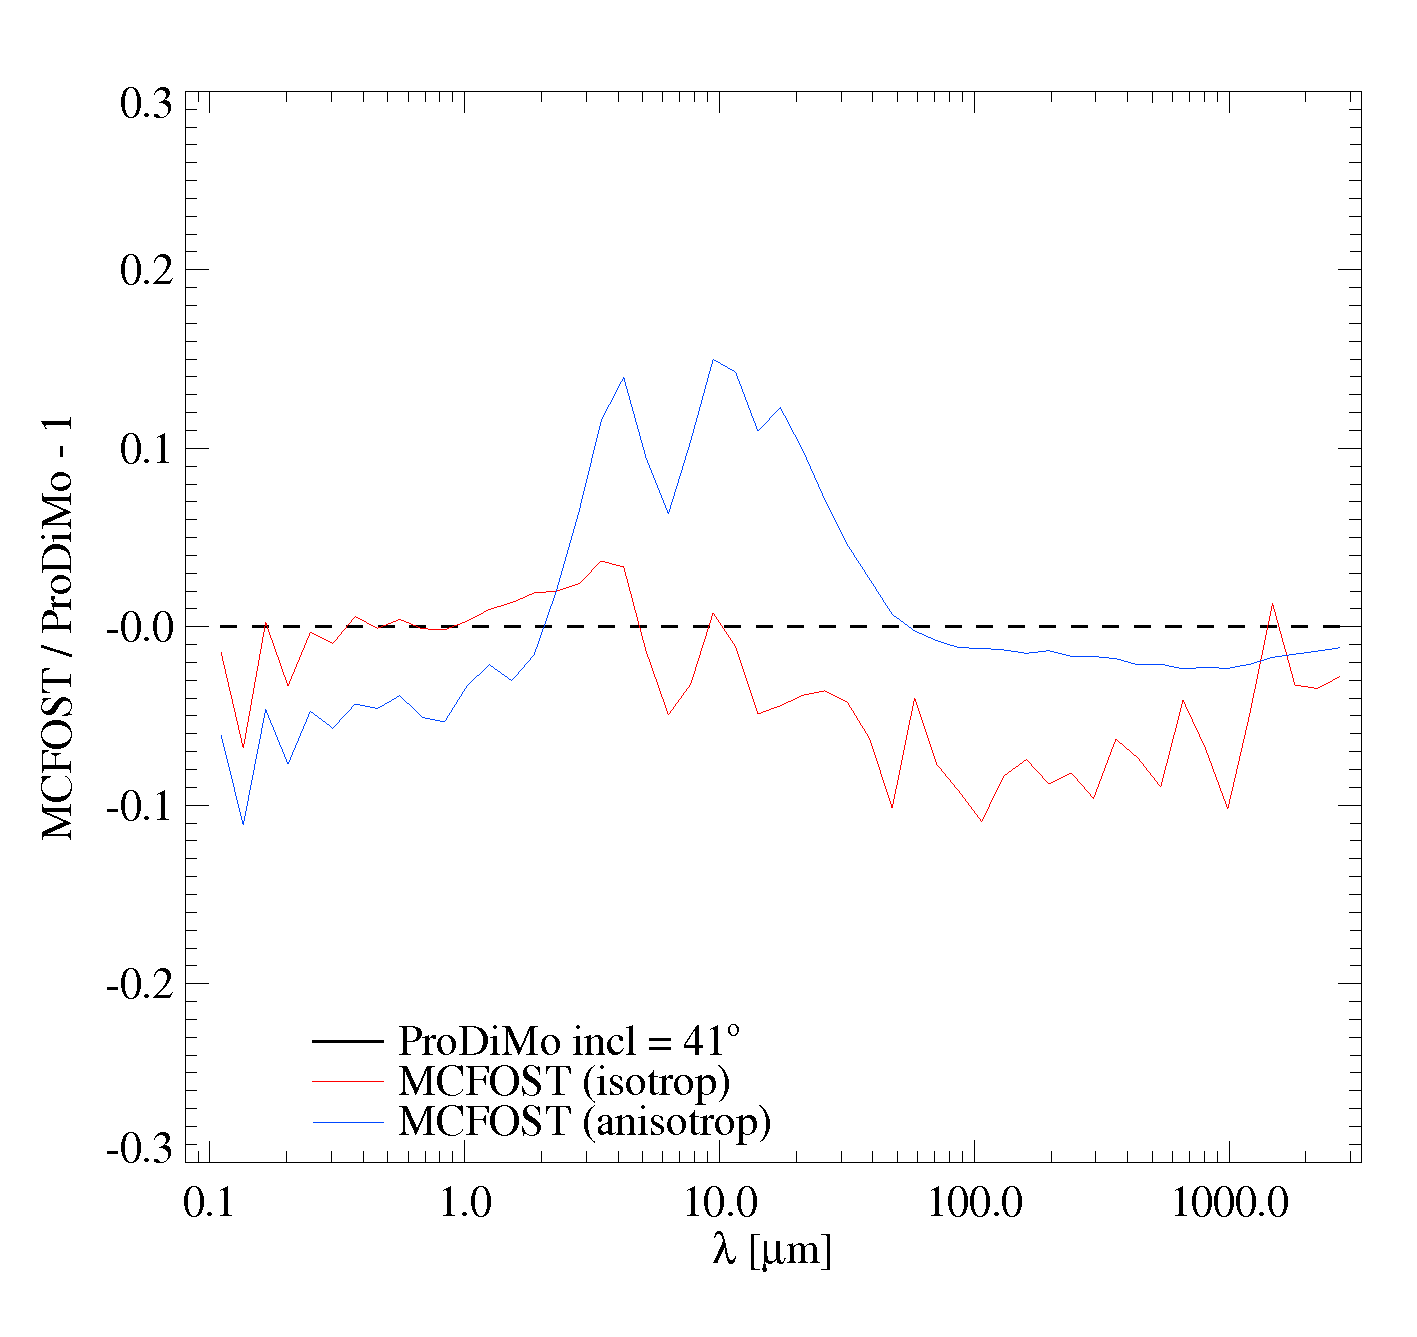
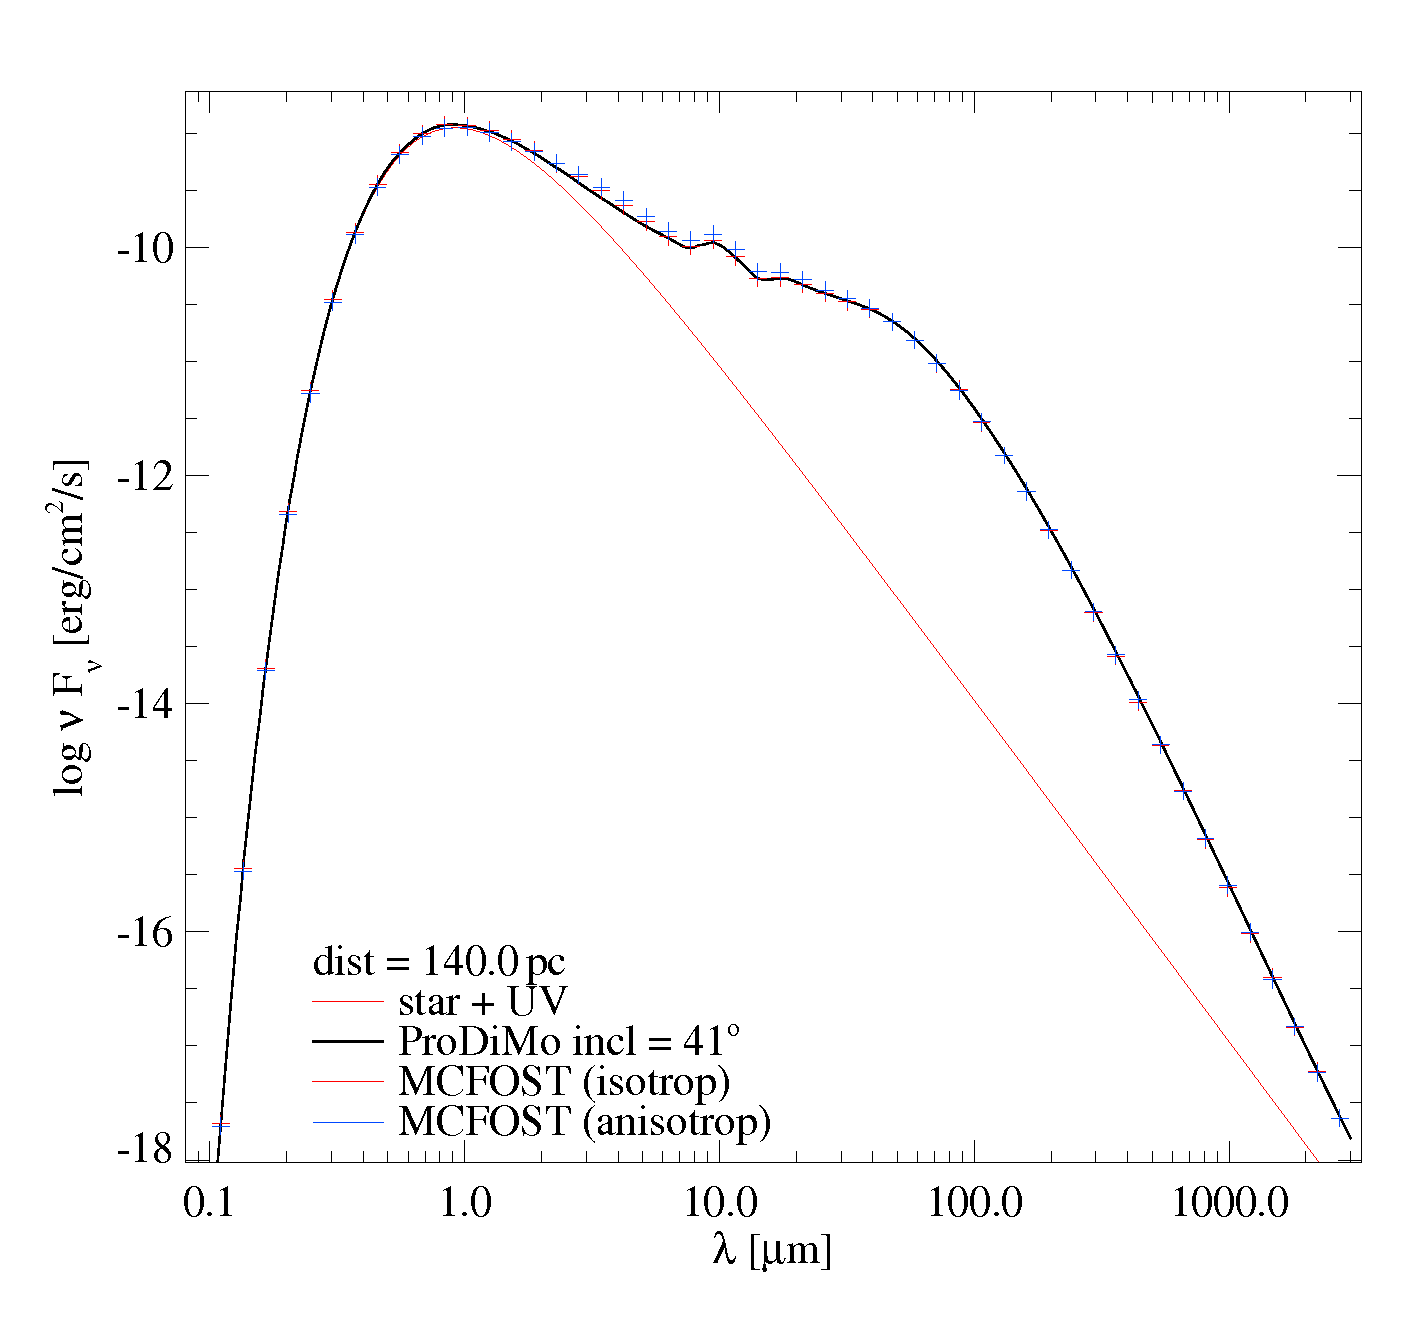
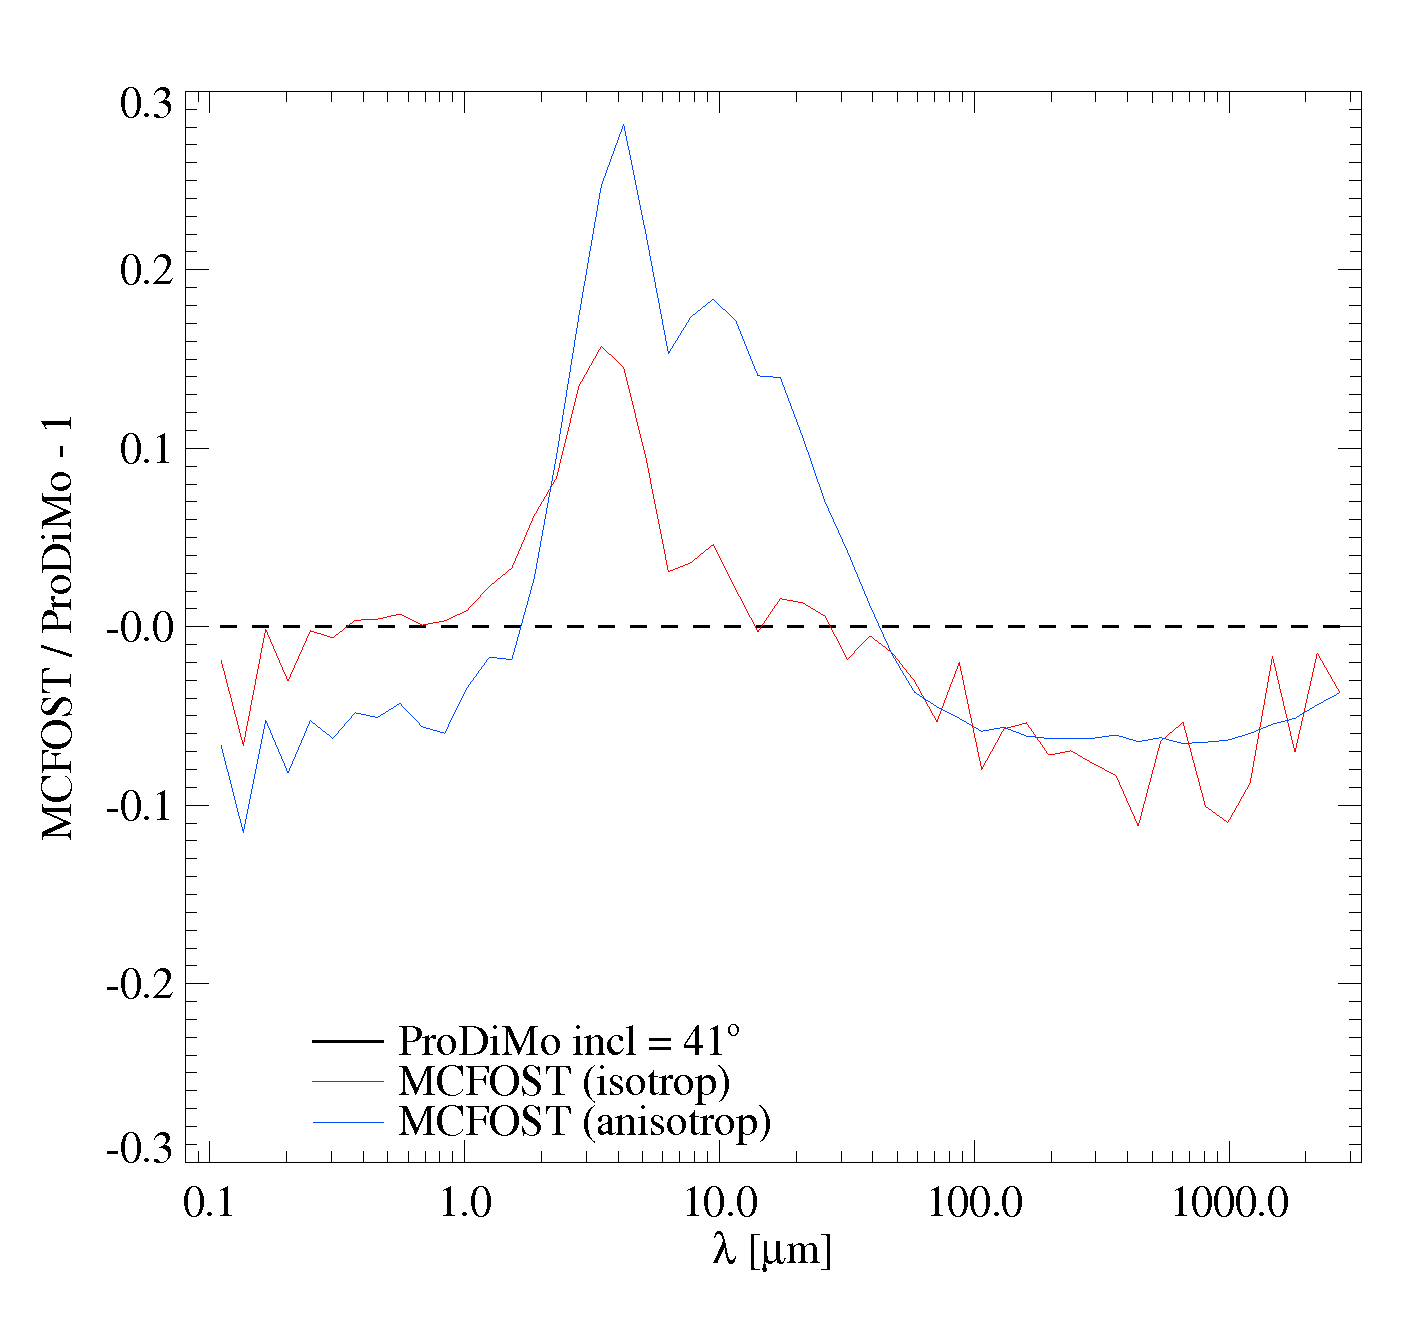
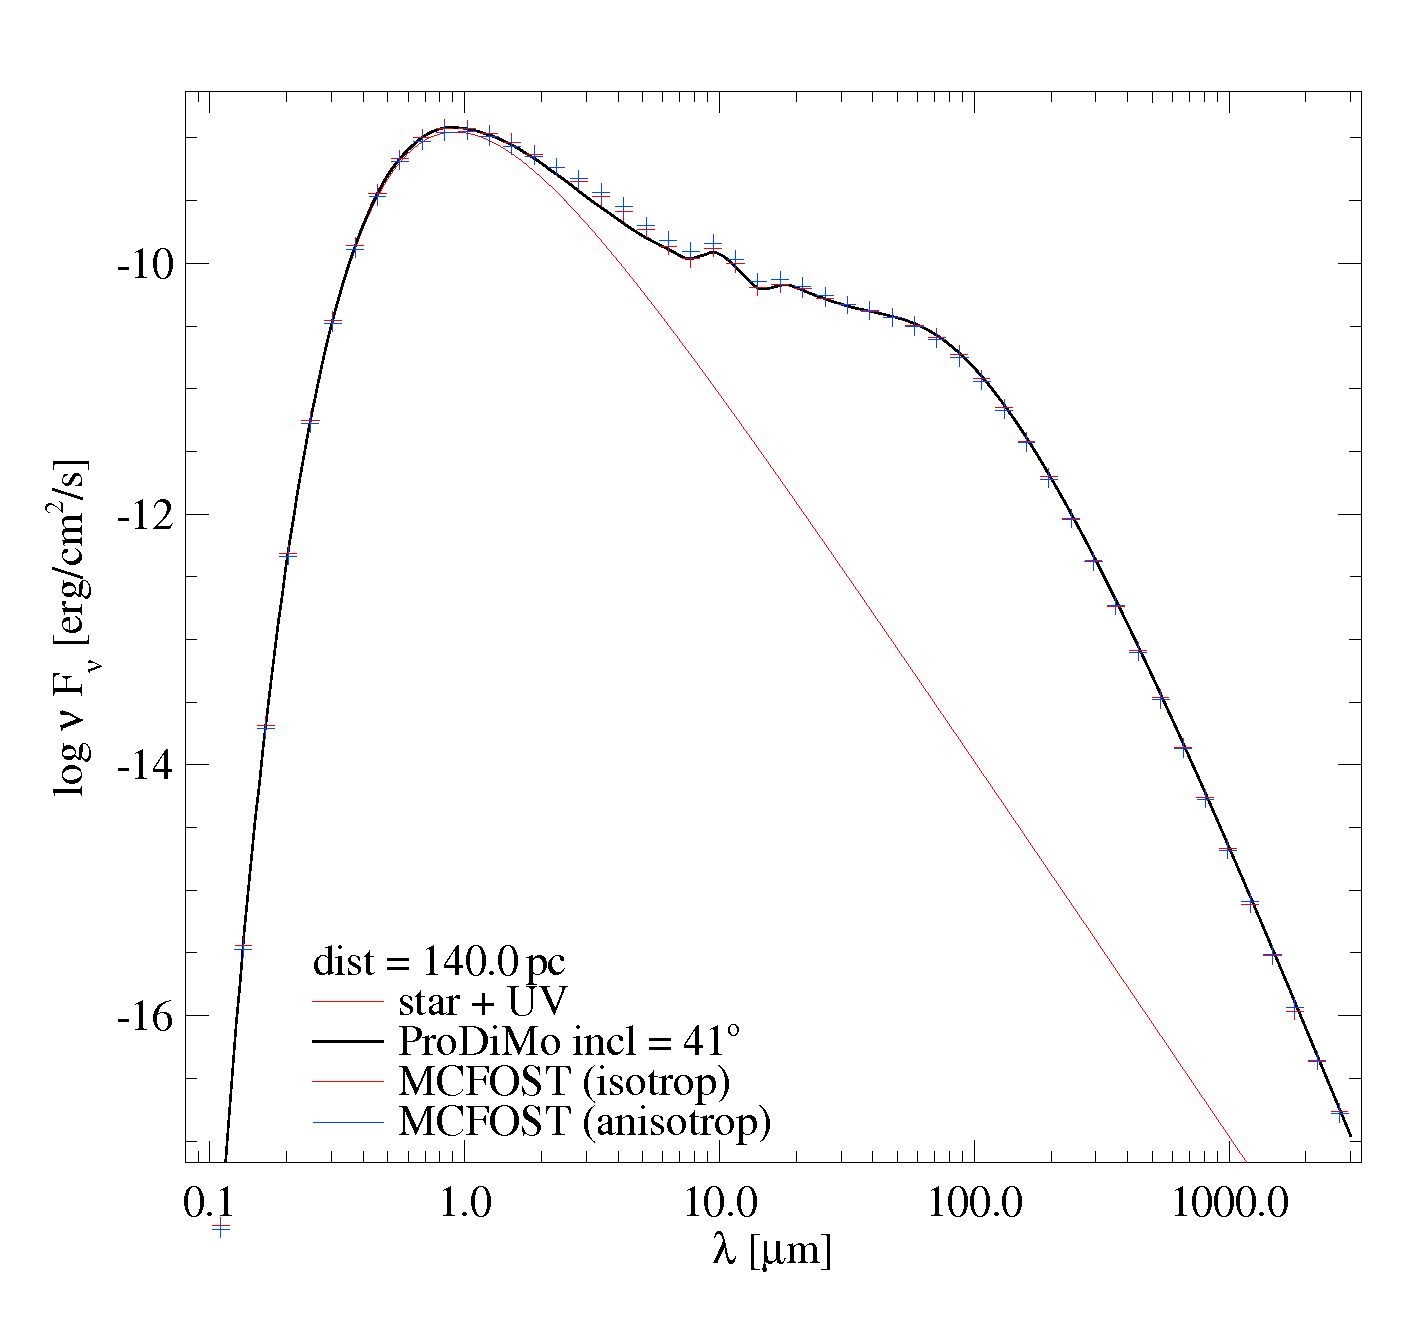
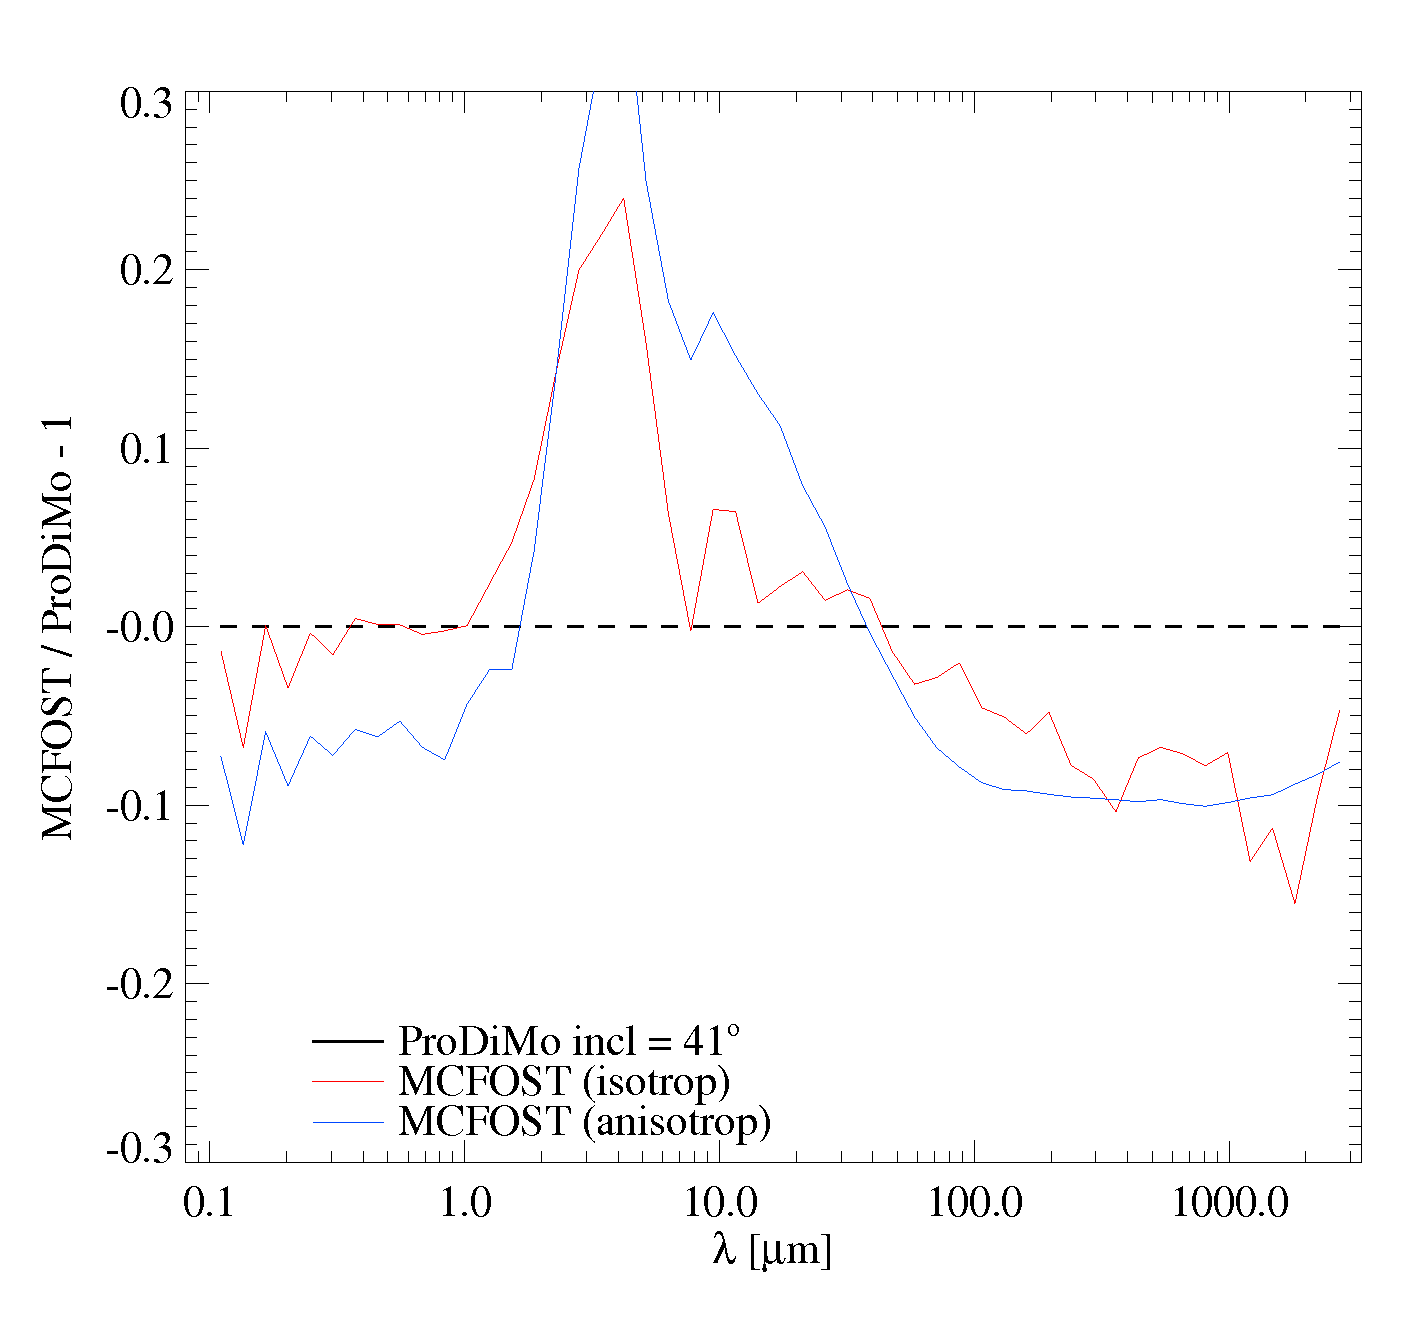
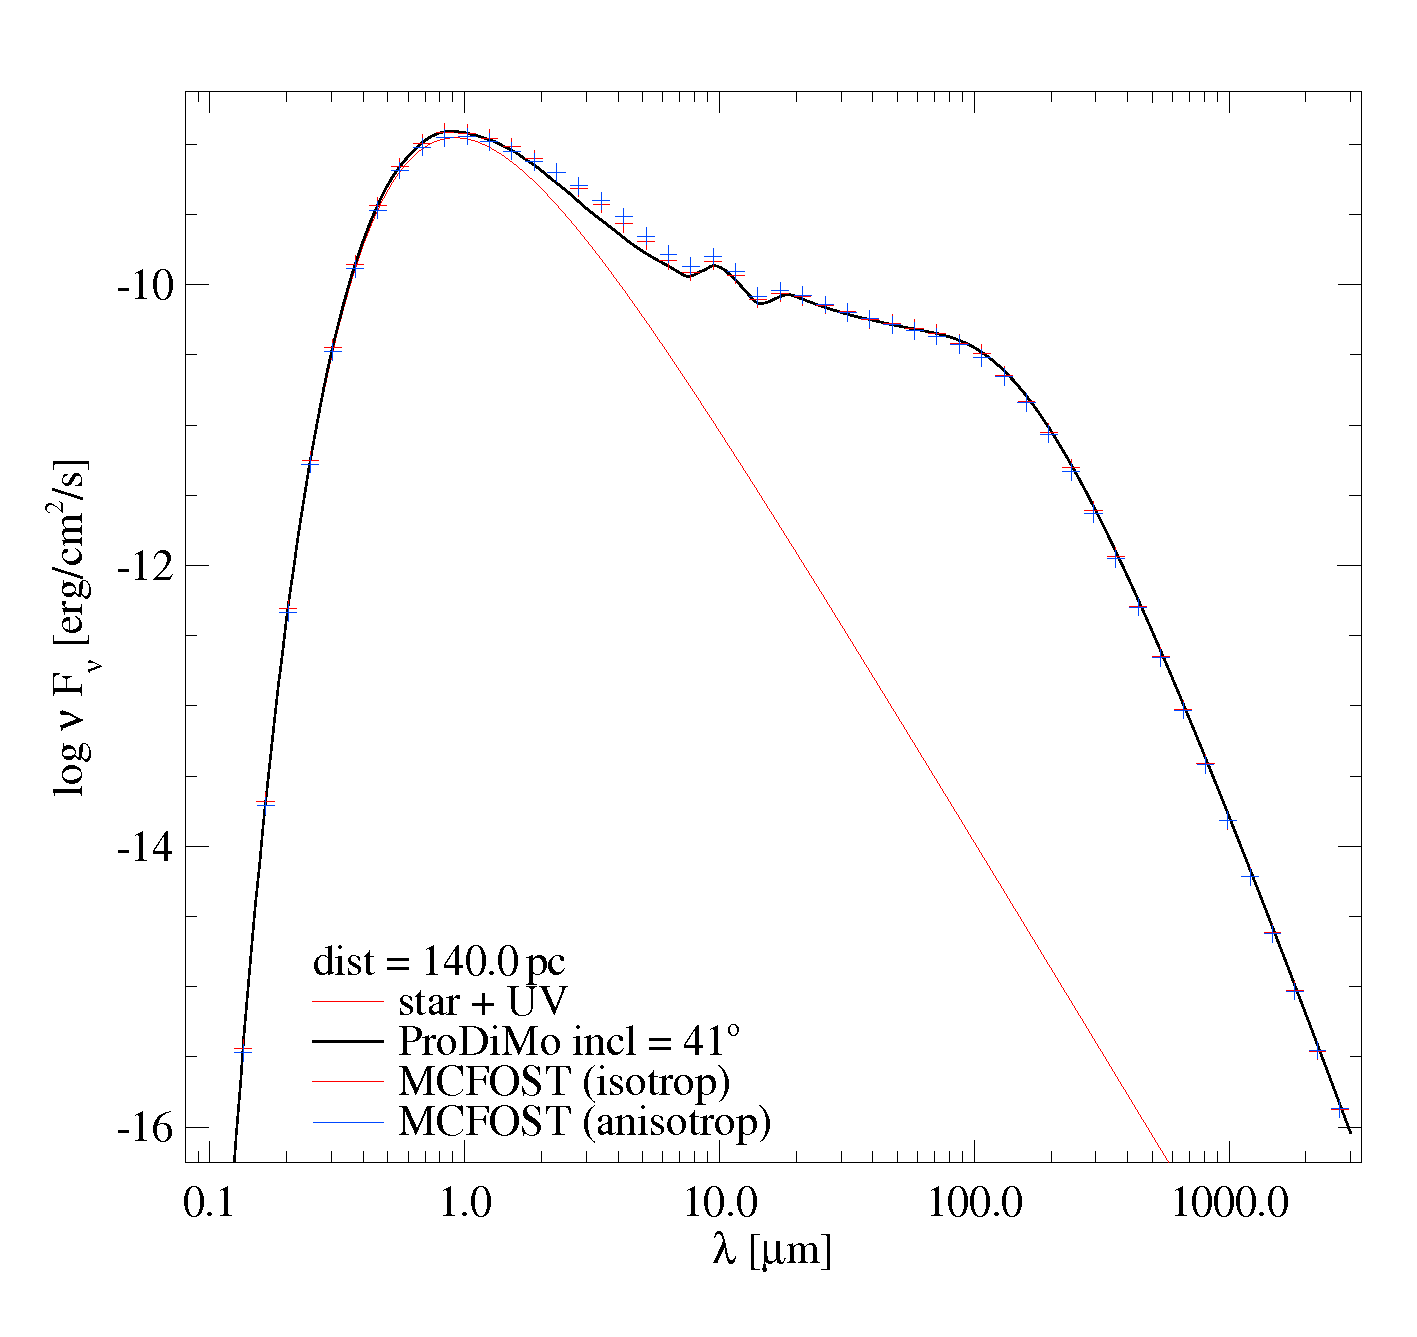
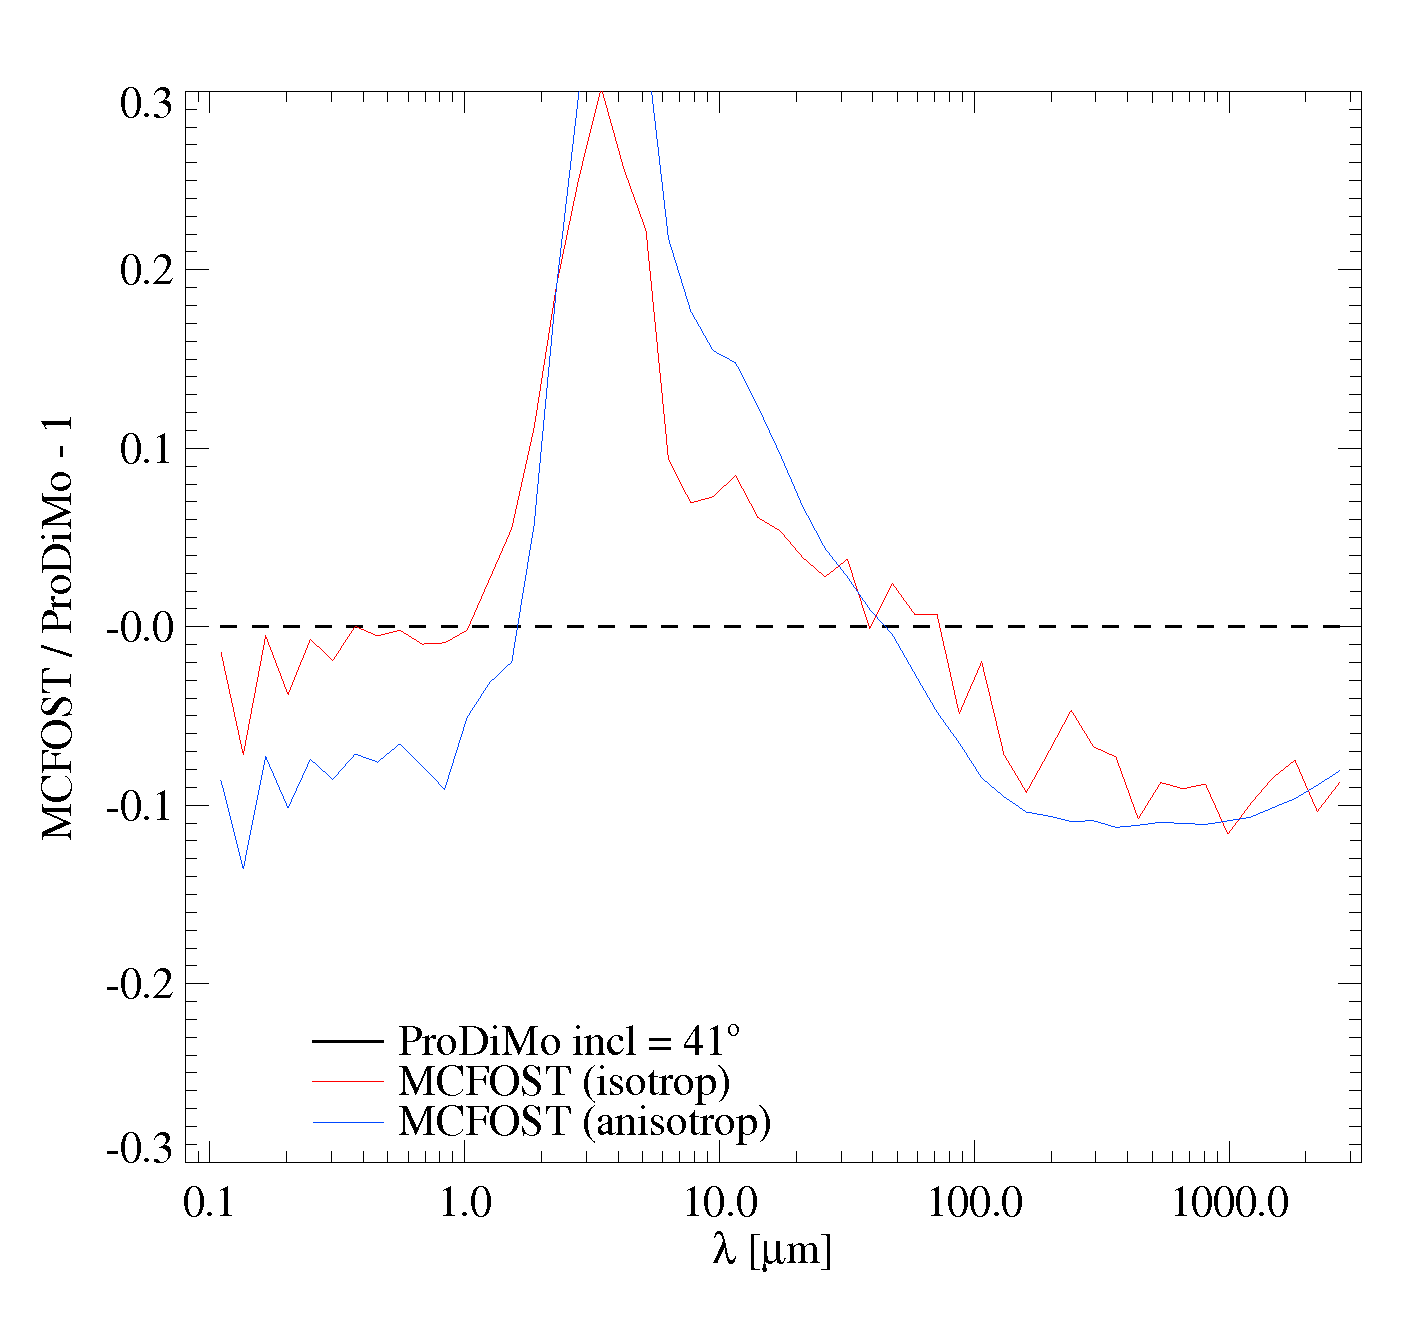
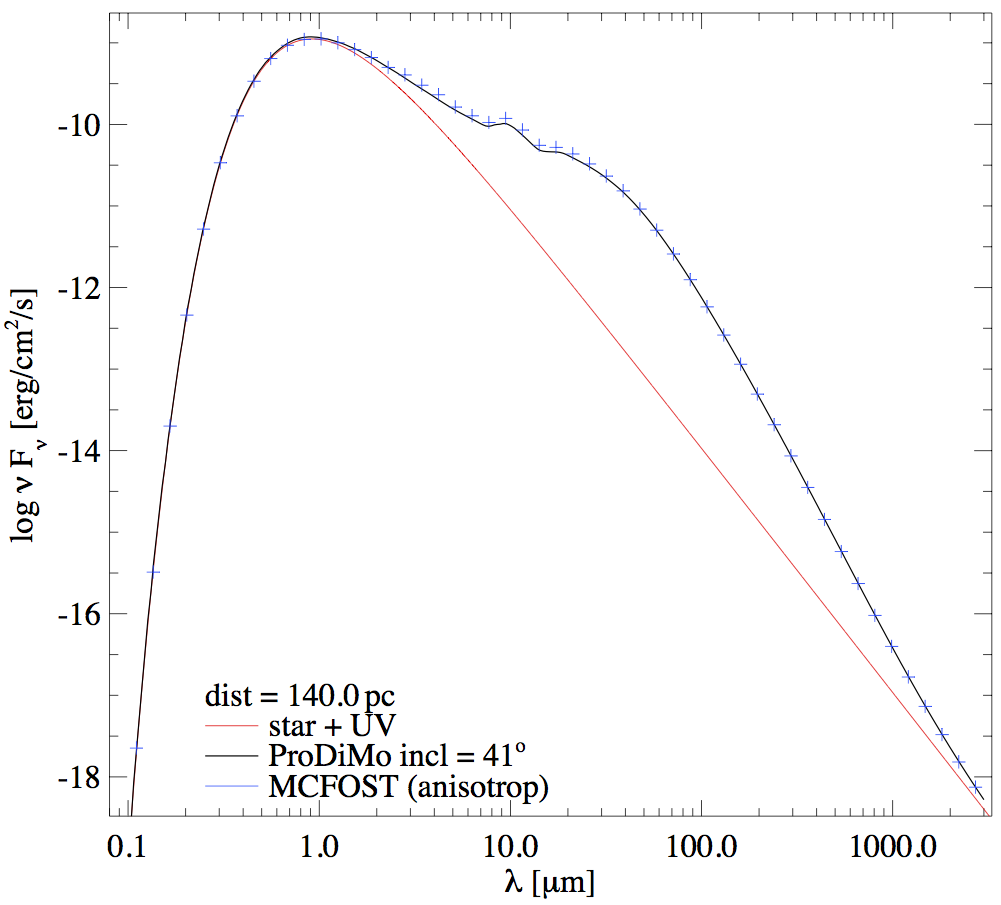
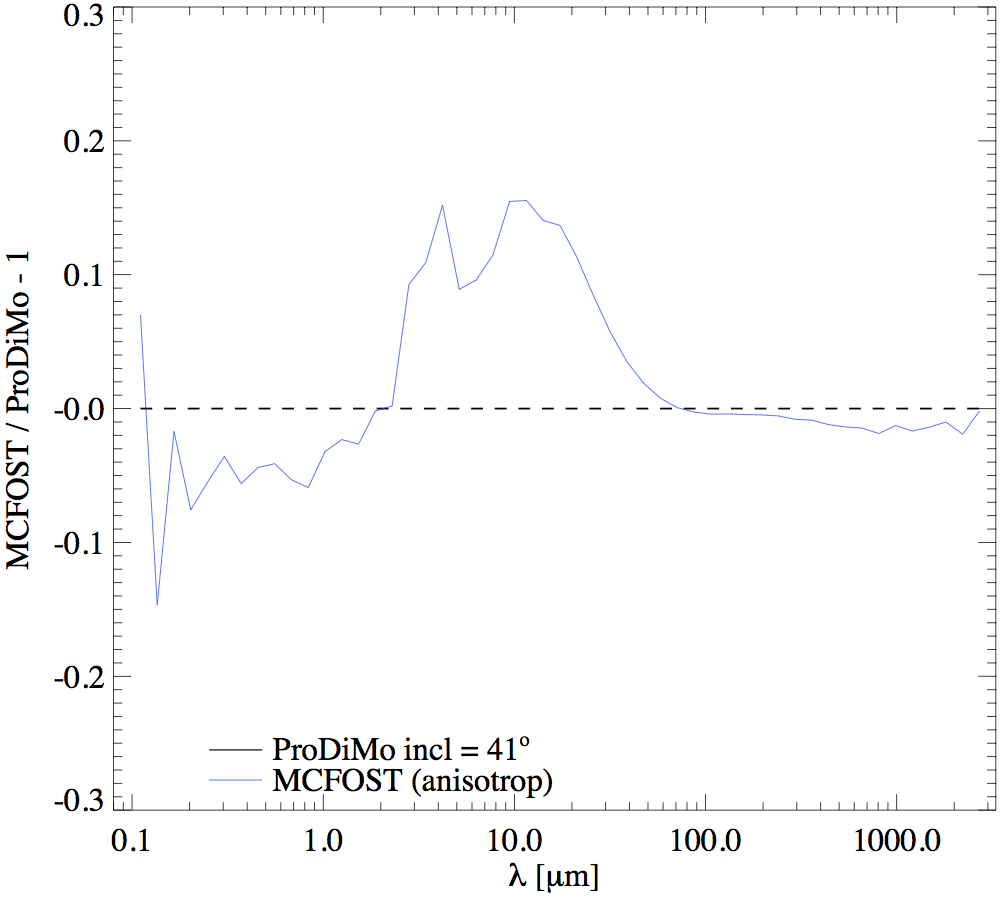
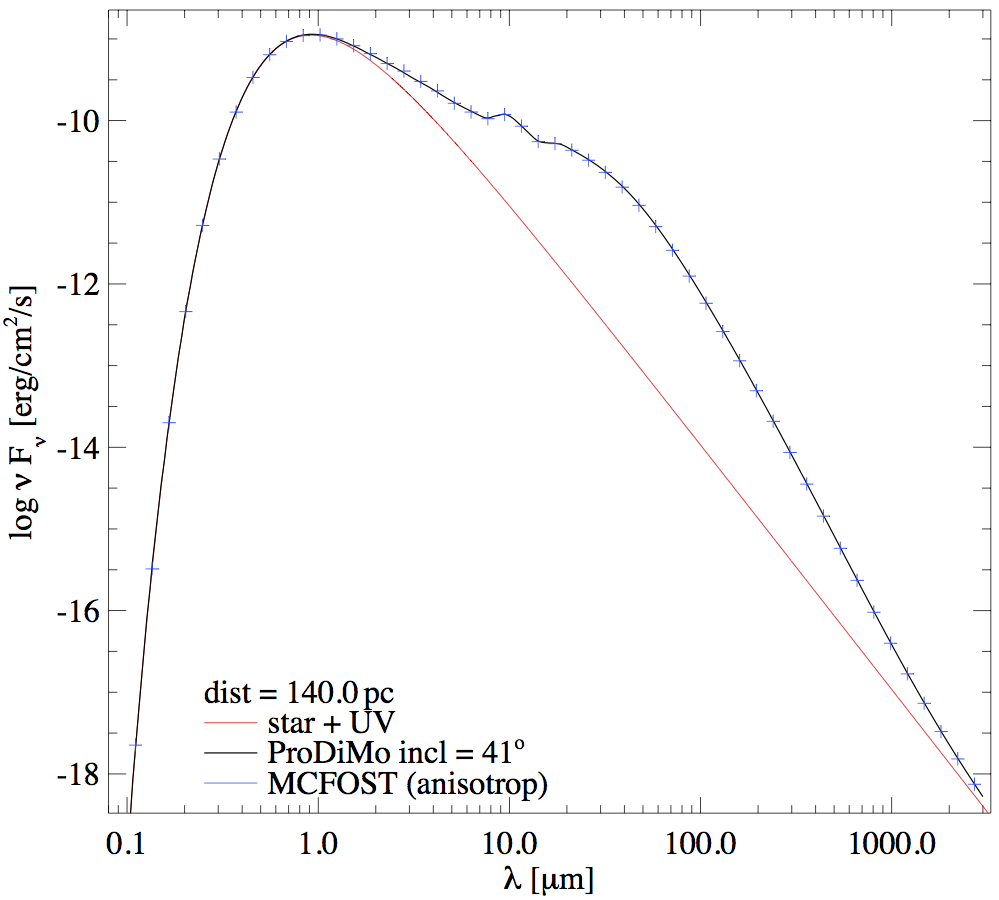
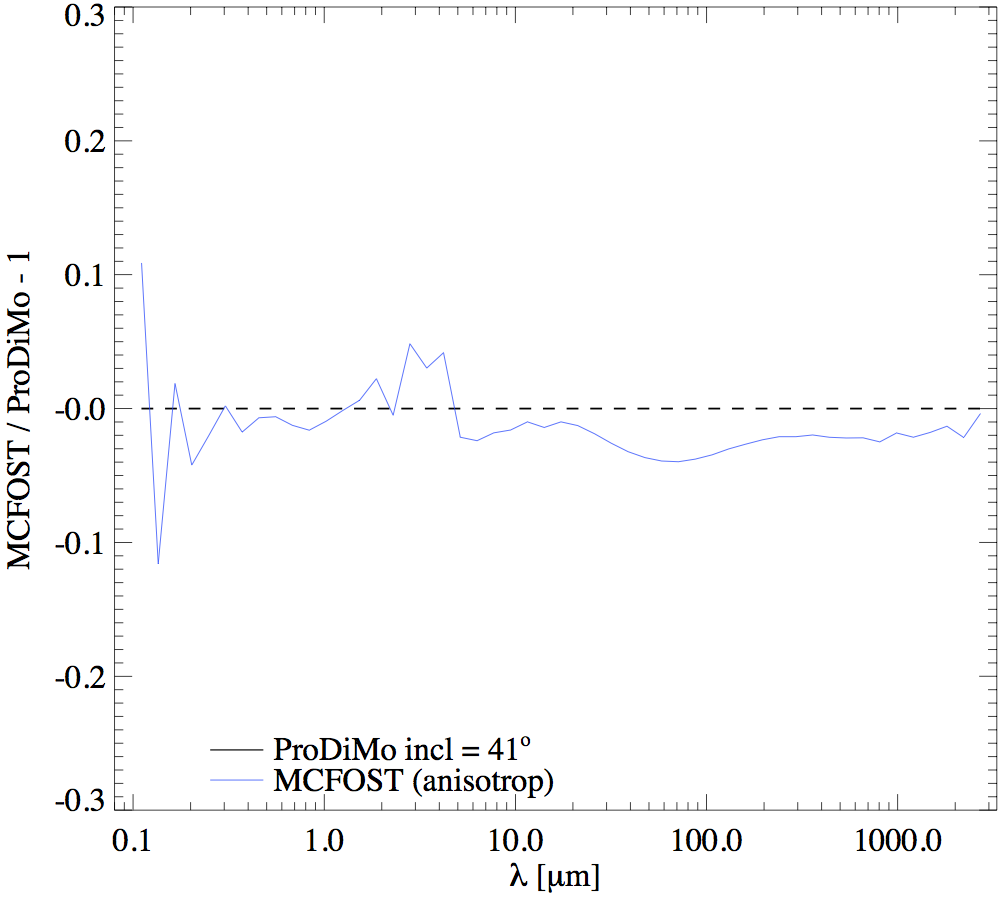
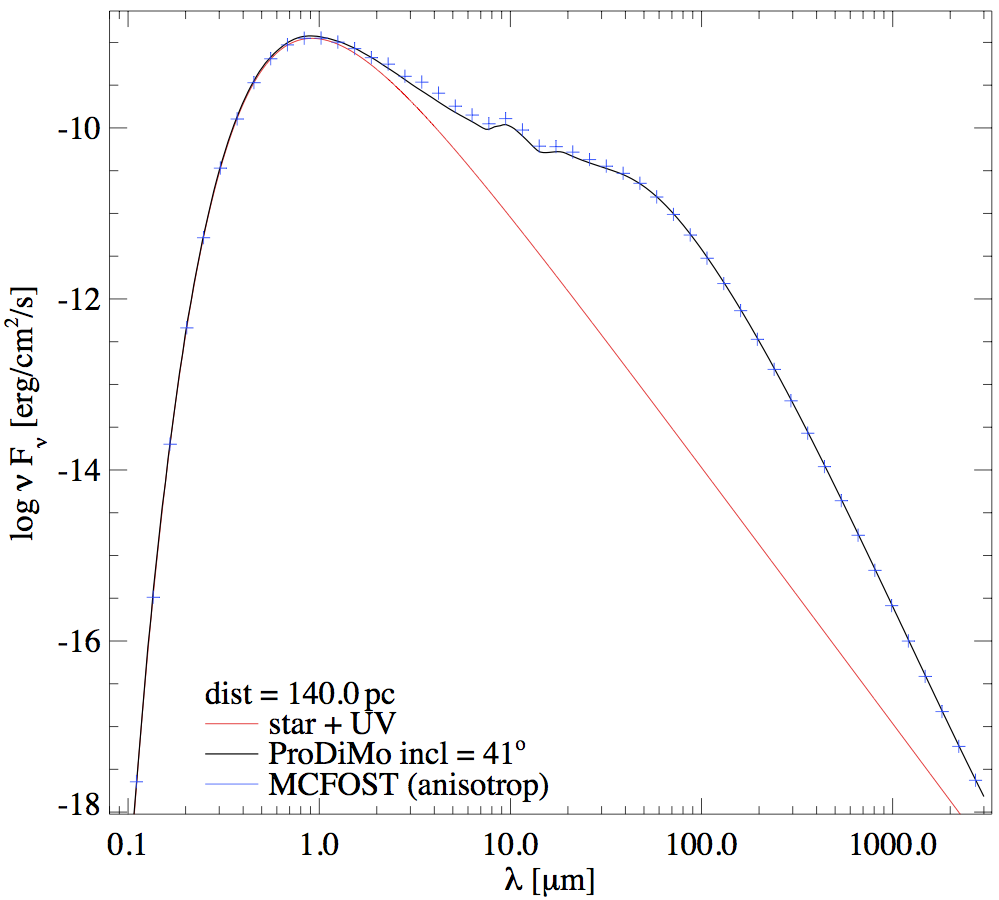
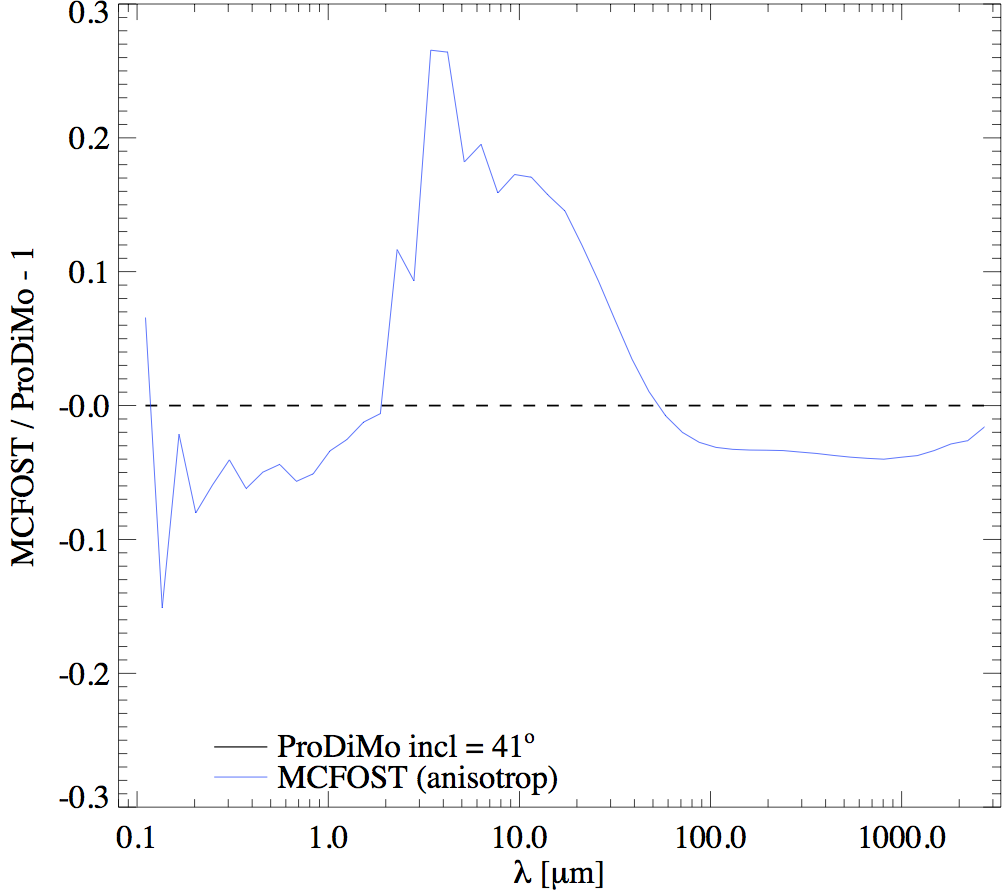
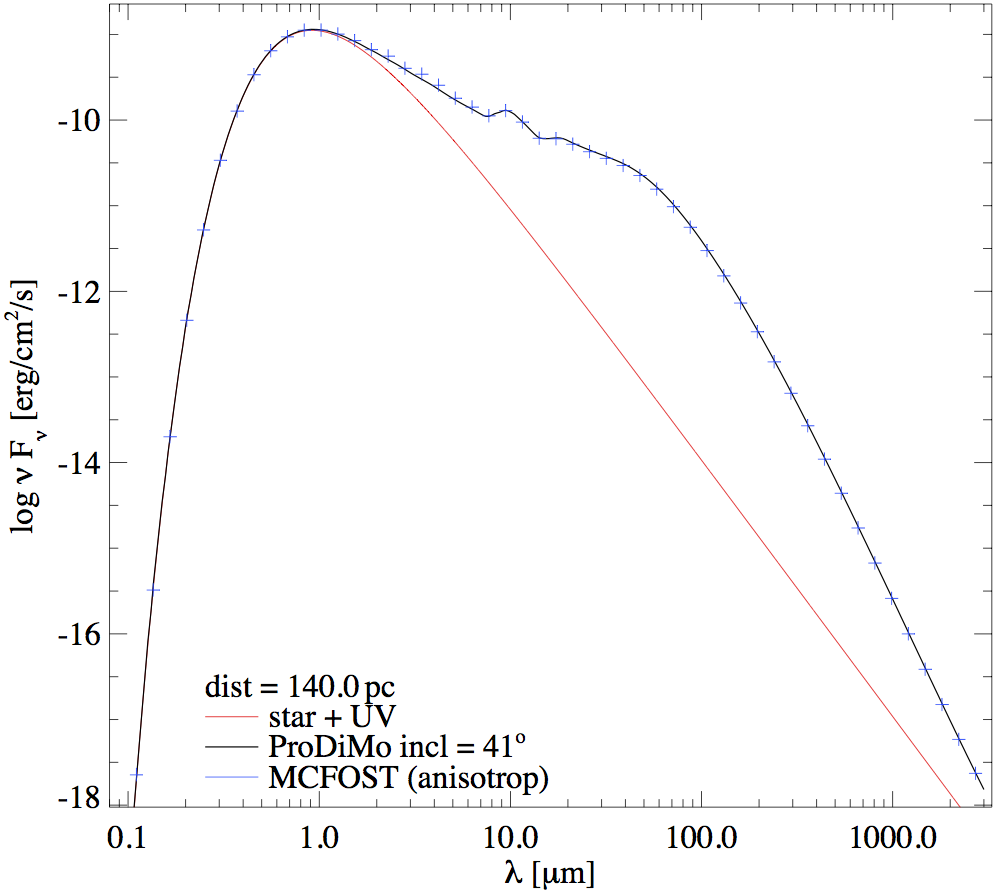
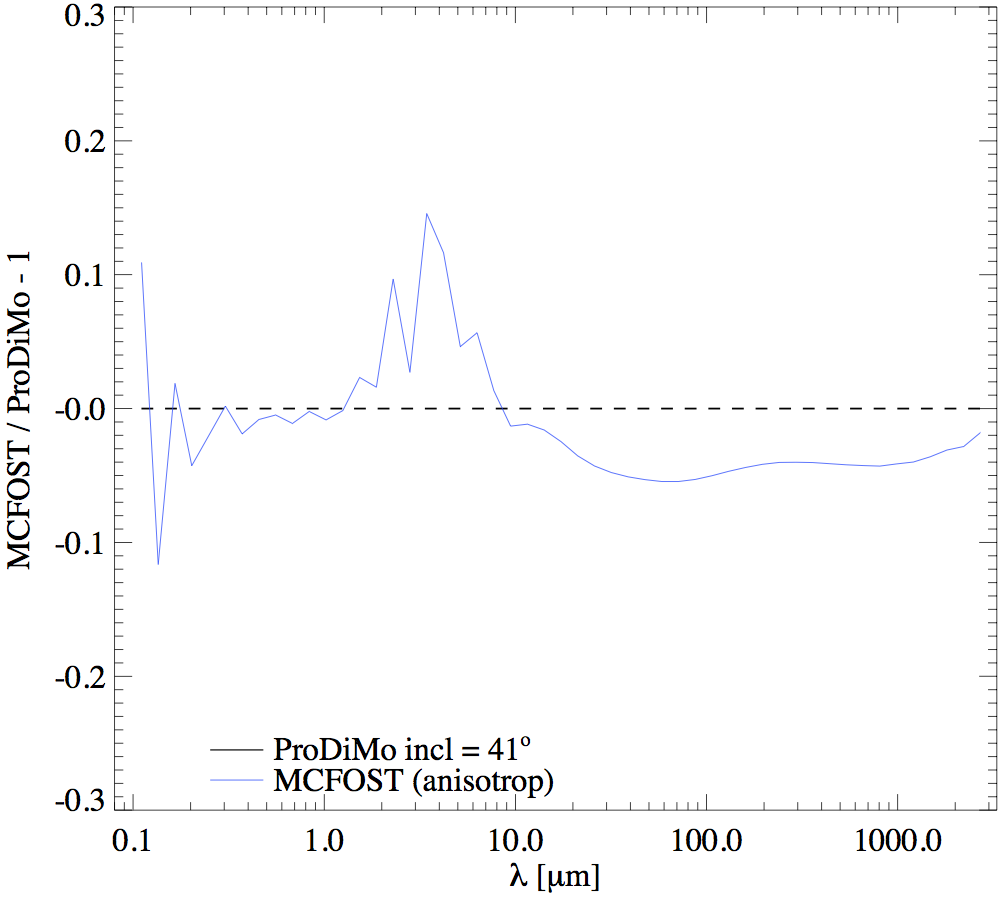
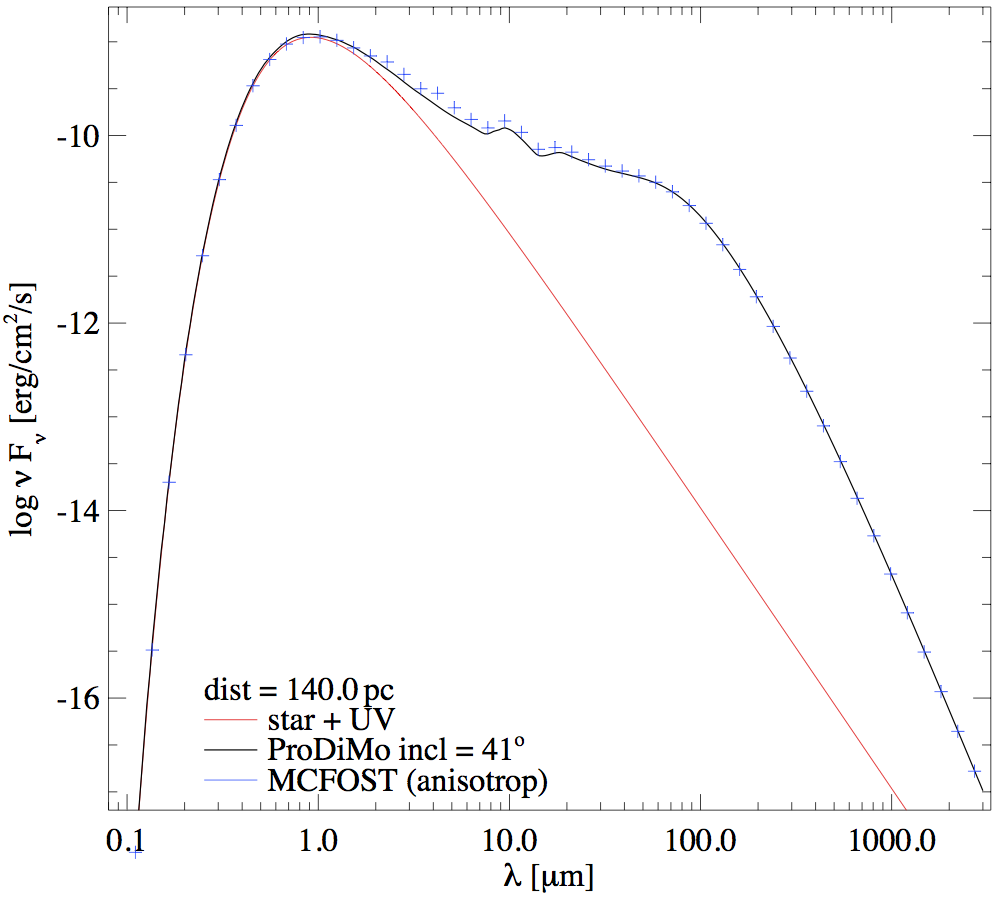
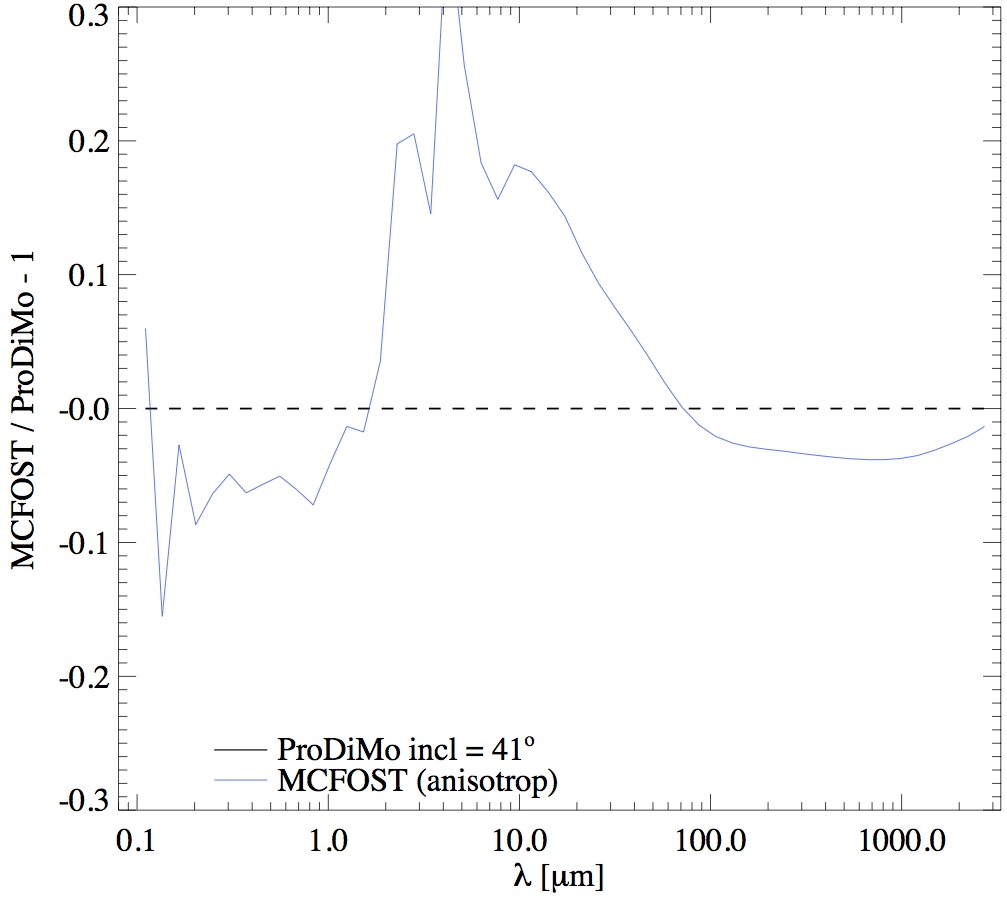
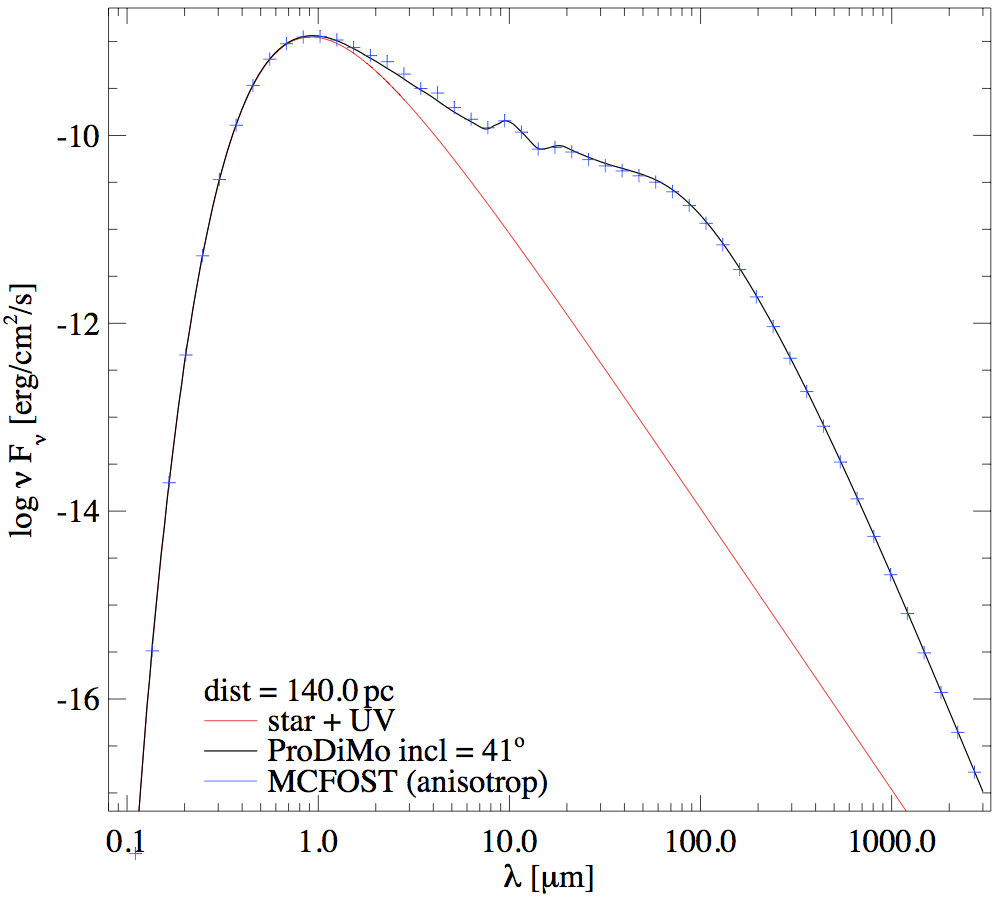
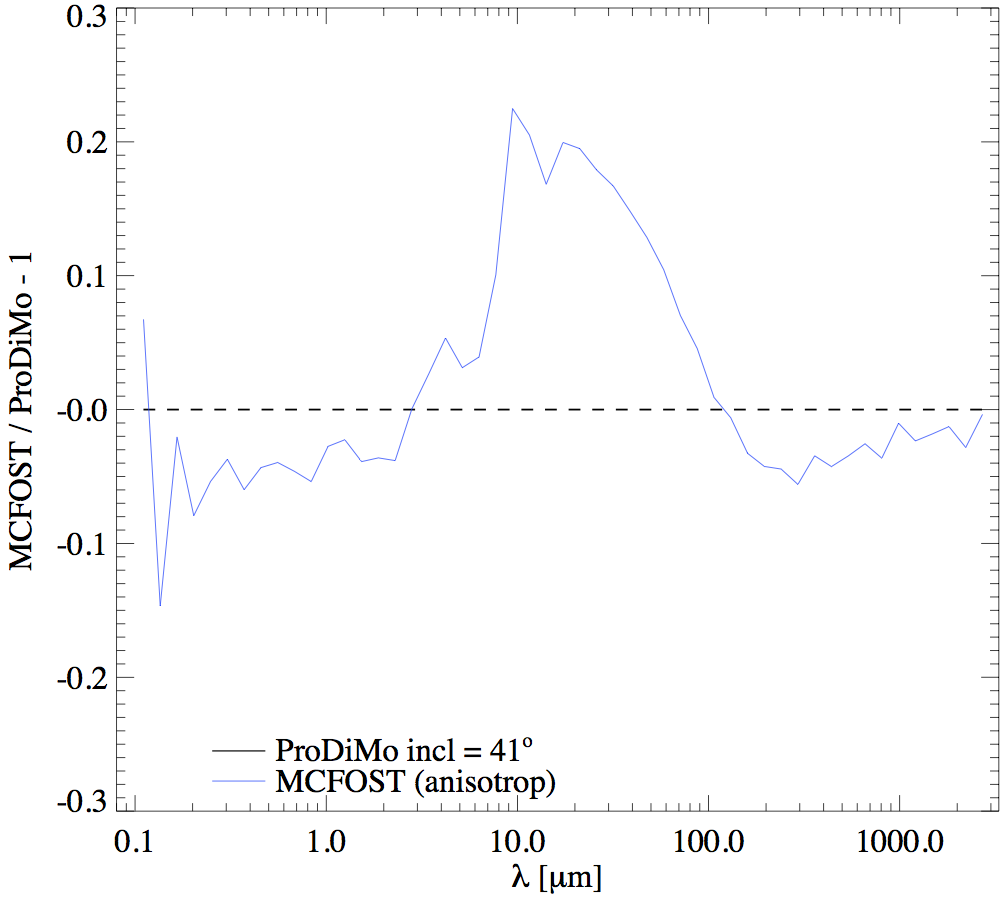
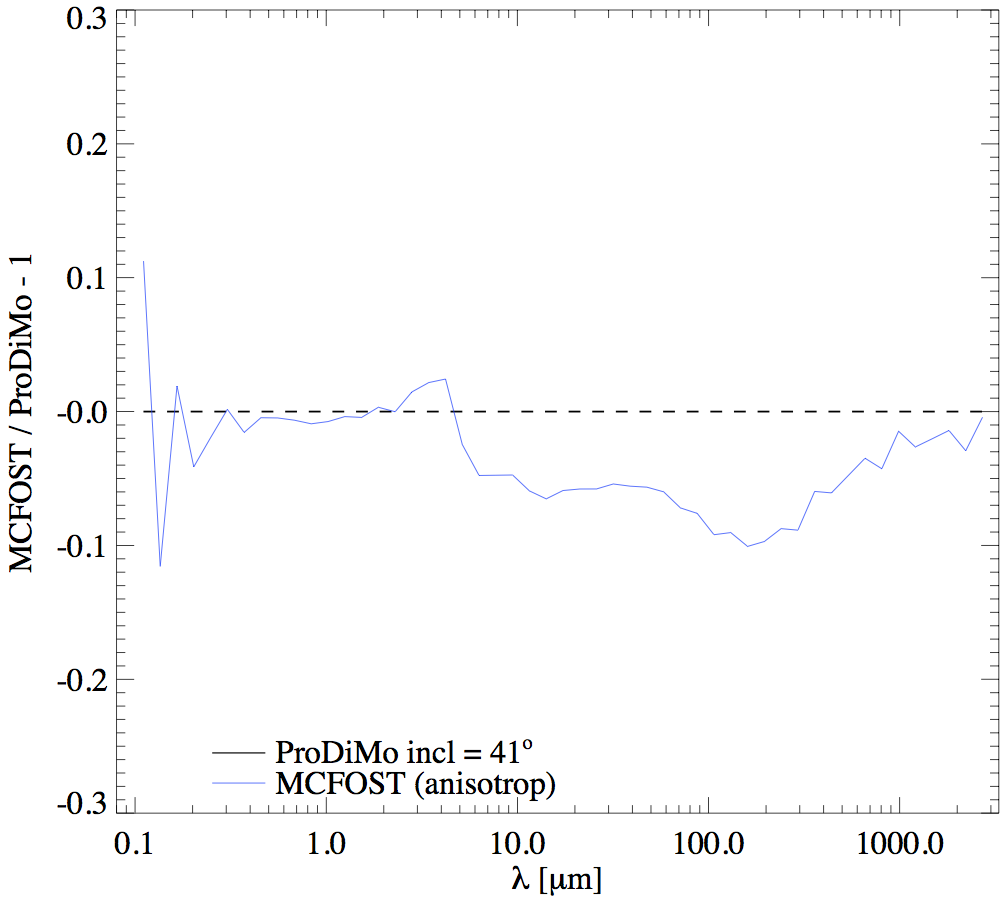
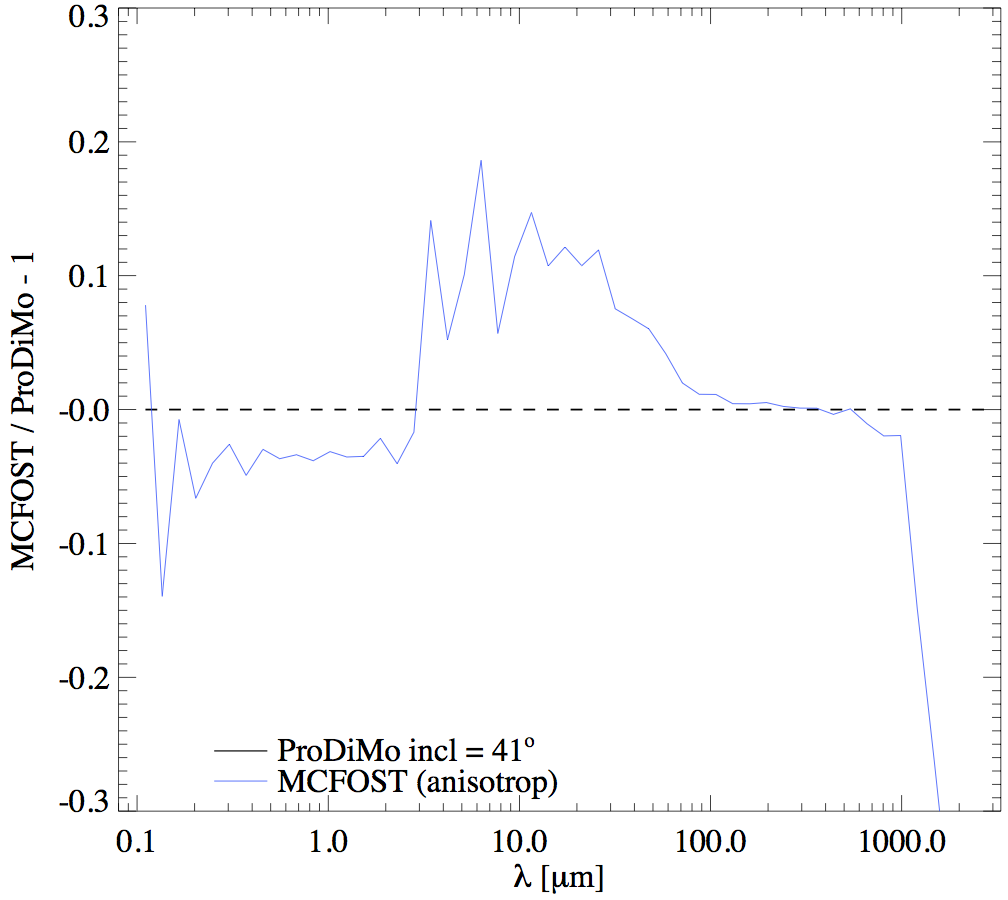
To summarize, this benchmark reveals the same principal weaknesses of ProDiMo's continuum radiative transfer as described in RTparameter, namely (i) too high temperatures in the massively optically thick midplane parts close to the star, (ii) too low temperatures right at the inner rim. The latter is mainly responsible for the SED-deviations, which are strongest around 2-5 micron, whereas the temperature-deviations in the deep midplane have little effect on the SED.
Radiative Transfer Benchmark test with pseudo anisotropic scattering
There is also a possibility to use an approximate anisotropic scattering method in the ProDiMo Radiative Transfer. This can be activated by setting
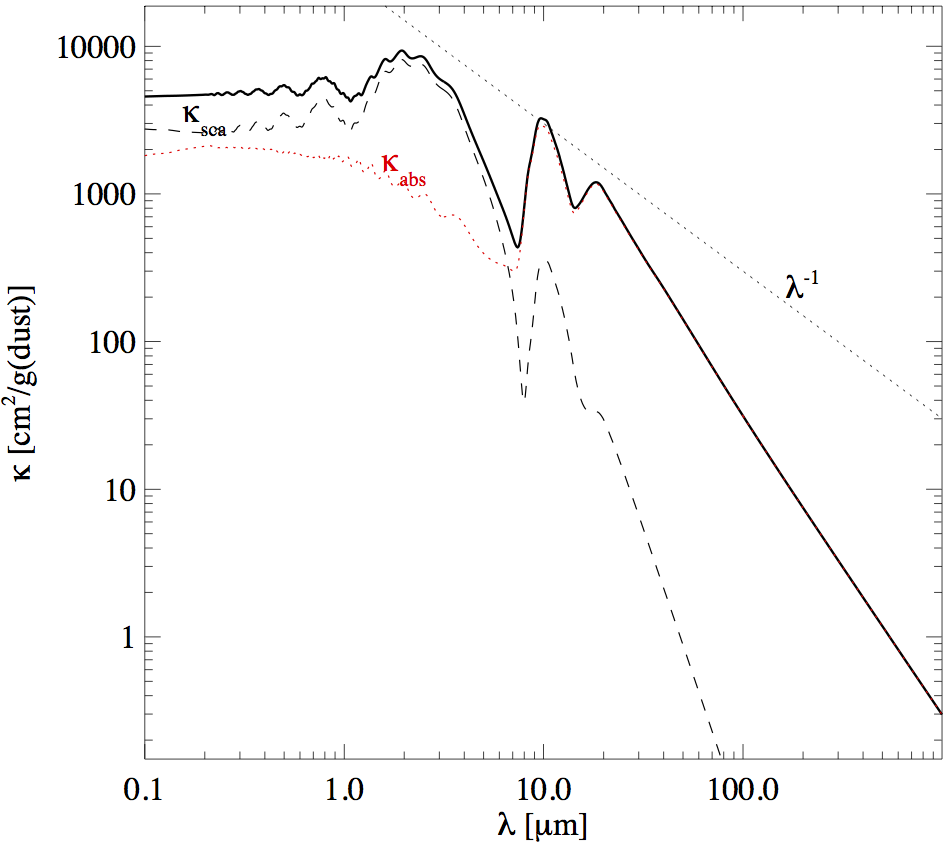
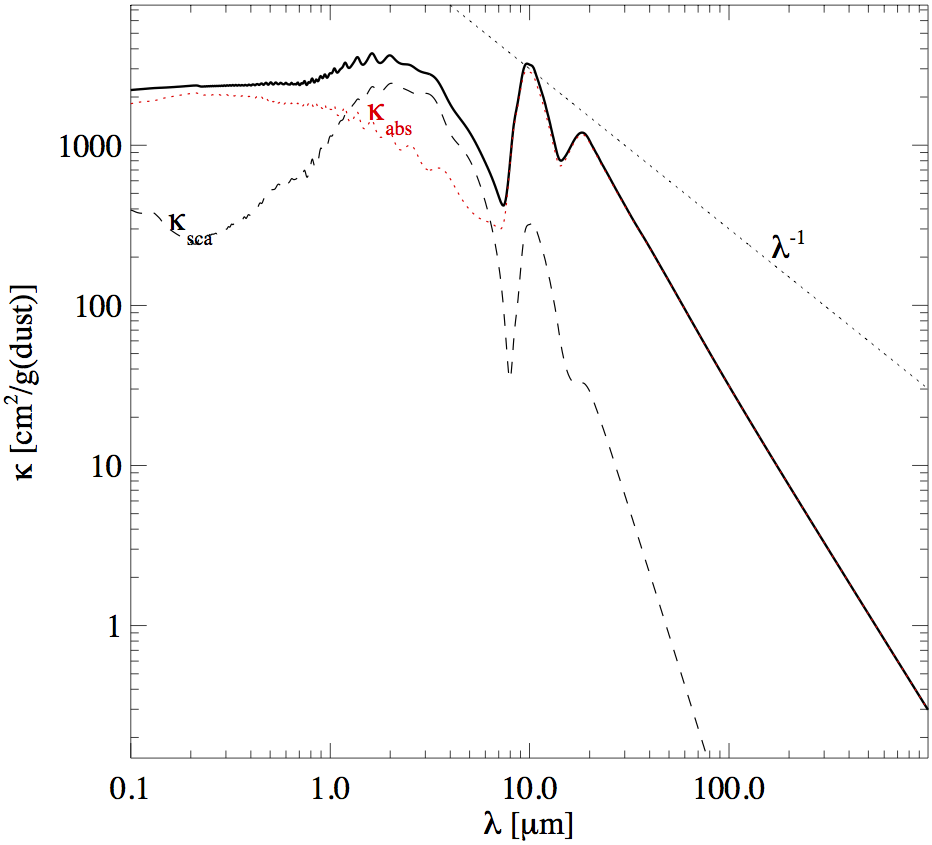
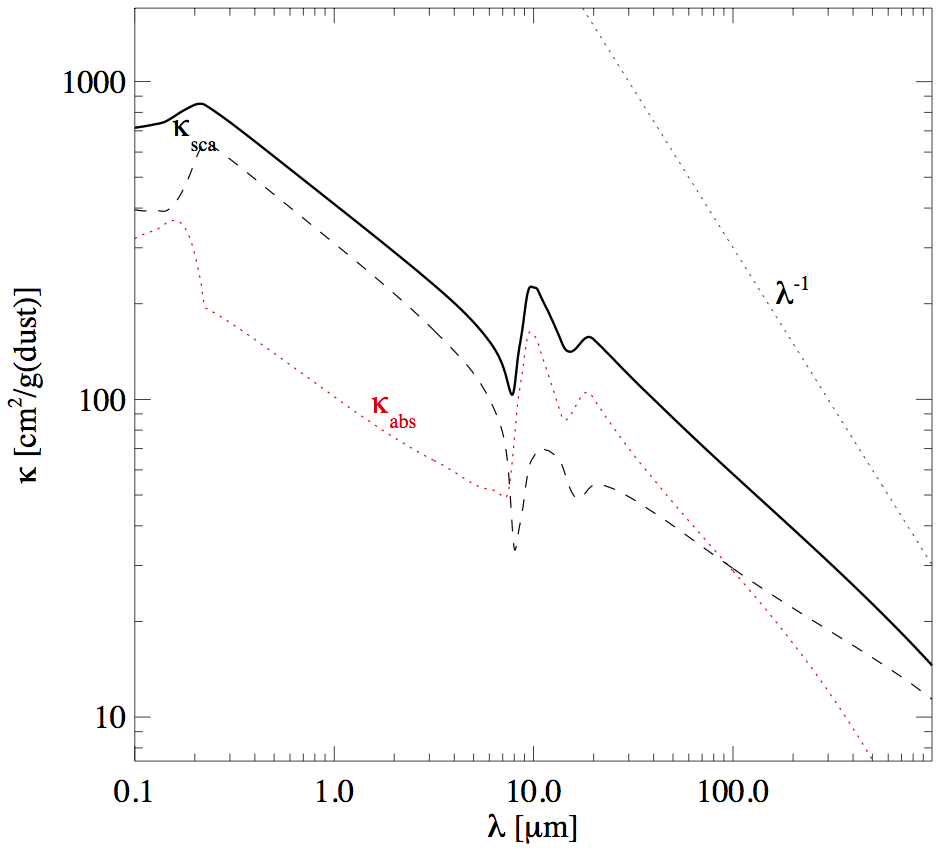
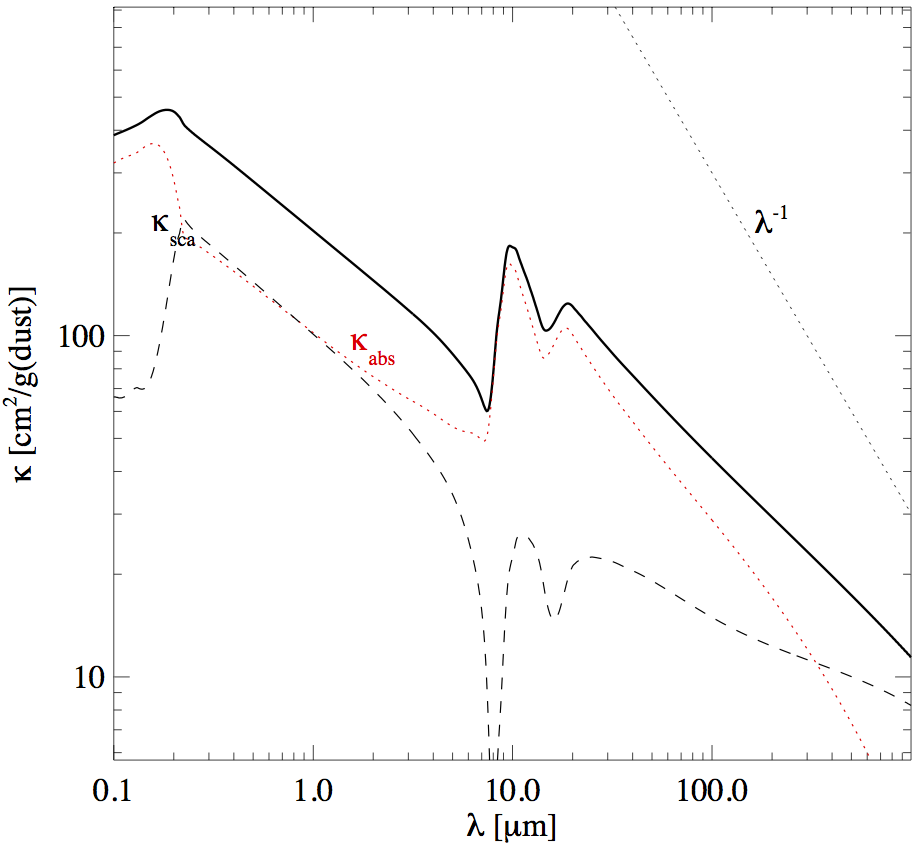
.true. ! pseudo_aniso_scatThis method alters the scattering opacity by the anisotropic factor g. The scattering opacity is then given by
scat_aniso=scat*(1-g)g is in the range [-1,1]. g=1 means pure forward scattering (which is equal to no absorption), g=-1 means complete backward scattering, and g=0 would be the isotropic case (see also images below).
| Opacity Isotropic | Opacity Anisotropic (g-factor) | Opacity Isotropic Grain sizes | Opacity Anisotropic Grain sizes (g-factor) |
|---|---|---|---|
 |
 |
 |
 |
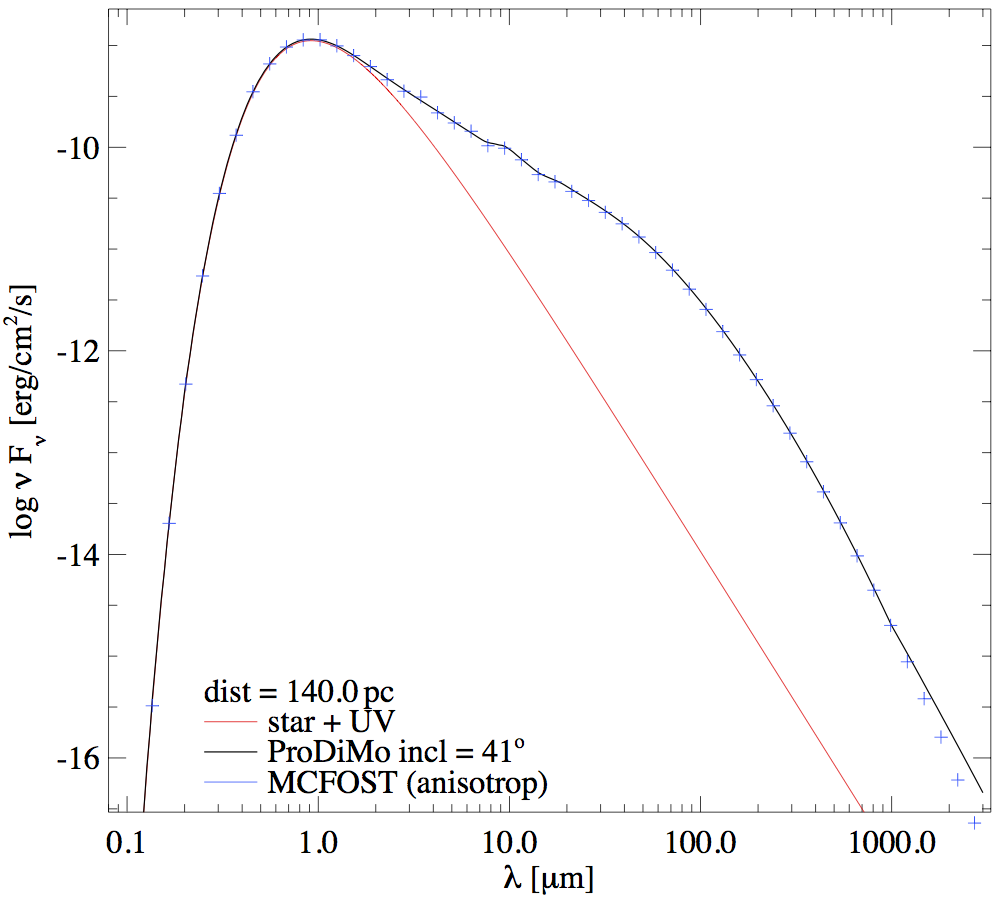
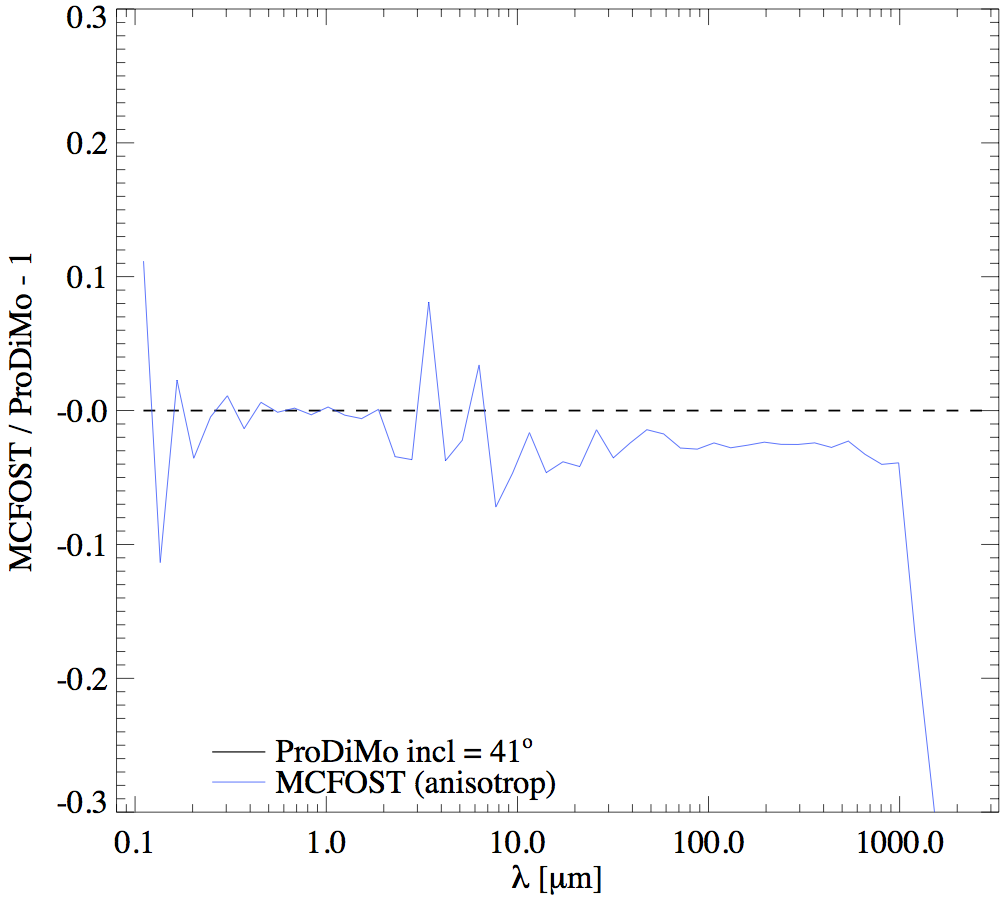
The here presented results compare the pseudo anistropic RT to the isotropic RT. For this the model Parameters from the Pinte RT Benchmark are used. The Parameters for ProDiMo (NXX,NZZ etc. see also Parameter.in in the attachments) are the same as above (Radiative Transfer Benchmark test).
The results of ProDiMo are compared to the results of MCFOST (Version 2.15.2, see also mcfost.para in the attachments). Differently to the RT Benchmark results presented above the star in MCFOST is not a point source. (Ch. Rab: I don't know how to do this in MCFOST ). So the here presented results are not exactly the same as above, but this does not matter as we only want to compare the two different scattering implementations in ProDiMo.
Click on the images to see something ...
tau = 1.E+3
isotropic scattering
 |
 |
 |
 |
anisotropic scattering
 |
 |
 |
 |
tau = 1.E+4
isotropic scattering
 |
 |
 |
 |
anisotropic scattering
 |
 |
 |
 |
tau = 1.E+5
isotropic scattering
 |
 |
 |
 |
anisotropic scattering
 |
 |
 |
 |
tau = 1.E+6
isotropic scattering
 |
 |
 |
 |
anisotropic scattering
 |
 |
 |
 |
tau = 1.E+1
The same as the other RT Benchmark tests but with a lower dust mass to check also the case of low optical depths.
isotropic scattering
 |
 |
 |
 |
anisotropic scattering
 |
 |
 |
 |
tau = 1.E+4 gs (grain size distribution)
The same as the RT Benchmark test case tau = 1.E+4 but with a grain size distribution with the following parameters: amin=0.05 (micrometre), amax=1000 and apow=3.5.
isotropic scattering
 |
 |
 |
 |
anisotropic scattering
 |
 |
 |
 |
Maximum and Average Deviations
The following table shows the maximum and mean (standard-deviation) dust temperature and SED-flux deviations:
| tau | mean T-dev. | max.T-dev. | mean SED-dev. | max.SED-dev | |
|---|---|---|---|---|---|
| 1.E+3 | iso | 5.5% | 18.5% | 6.7% | 15.5% |
| aniso | 5.3% | 13.6% | 2.9% | 11.6% | |
| 1.E+4 | iso | 5.6% | 22.9% | 9.4% | 26.5% |
| aniso | 5.2% | 12.7% | 4.8% | 14.6% | |
| 1.E+5 | iso | 7.3% | 26.8% | 10.4% | 37.3% |
| aniso | 6.2% | 16.3% | 6.0% | 20.9% | |
| 1.E+6 | iso | 12.8% | 33.2% | 14.8% | 39.7% |
| aniso | 10.2% | 27.6% | 8.0% | 27.1% | |
| 1.E+1 | iso | 10.8% | 25.4% | 8.7% | 22.5% |
| aniso | 4.2% | 11.6% | 4.0% | 11.6% | |
| 1.E+4 gs | iso-gs | 5.5% | 15.9% | 14.7% | 63.3% |
| aniso-gs | 5.1% | 12.8% | 13.2% | 64.8% |
Conclusions and Remarks
For all test cases, the anisotropic results are better for both the Temperature and the SED. Further, the convergence of the RT in ProDiMo is a bit better as the total extinction is reduced due to the reduction of the scattering opacity.
The high maximum deviations(SED) for the 1.E+4 grains size distribution test case are probably a result of the inaccurate treatment of dust opacities for wavelengths >1000 micrometre. The optical constants used in ProDiMo are only given up to 1000 micrometre and are extrapolated to longer wavelengths.
I don't know why the convergence of the RT in ProDiMo for the here presented test cases is much worse than for the test cases presented above.